29
/
en
AIzaSyAYiBZKx7MnpbEhh9jyipgxe19OcubqV5w
April 1, 2024
41544
Latin America & Caribbean
LCN
false
2
1
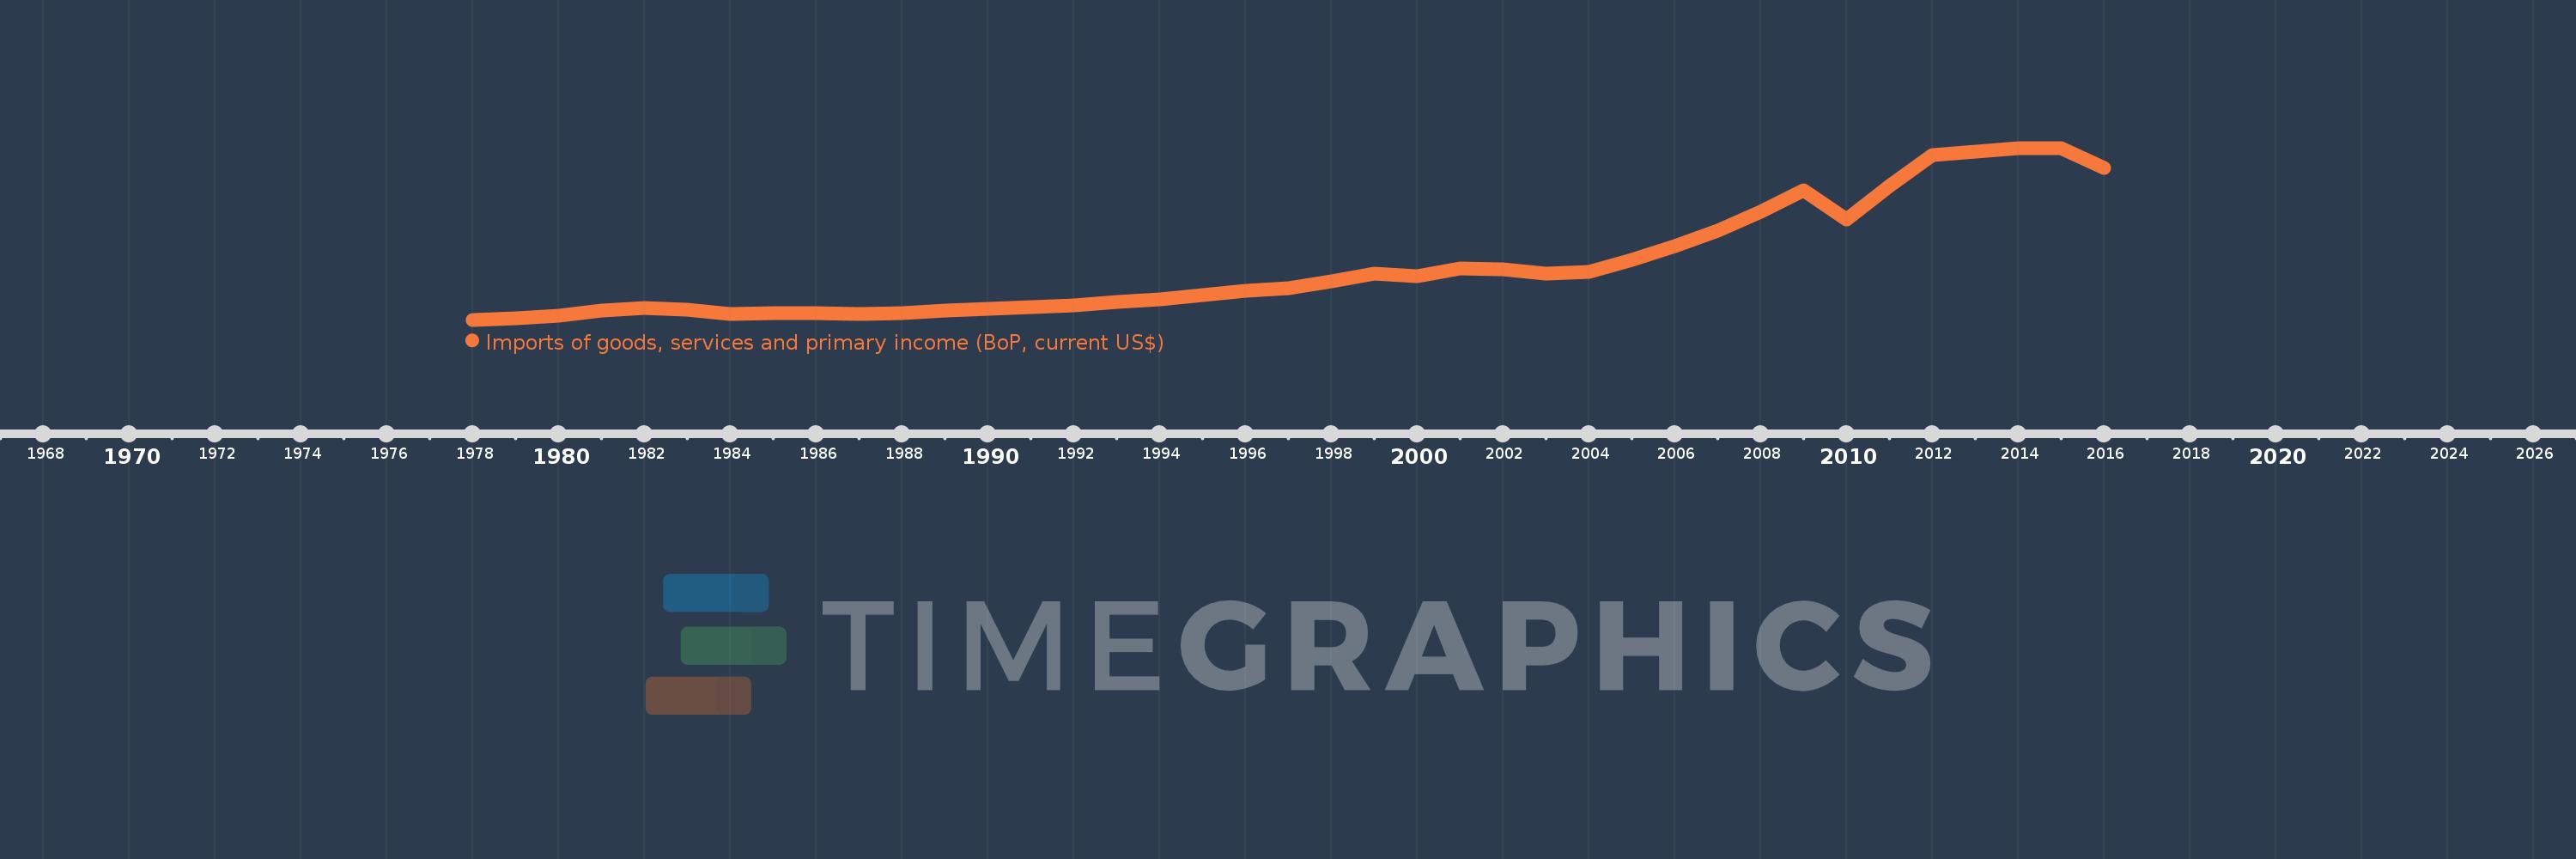
Imports of goods, services and primary income (BoP, current US$)
2016,2015,2014,2013,2012,2011,2010,2009,2008,2007,2006,2005,2004,2003,2002,2001,2000,1999,1998,1997,1996,1995,1994,1993,1992,1991,1990,1989,1988,1987,1986,1985,1984,1983,1982,1981,1980,1979,1978
This statistics in other country:
AfghanistanAlbaniaAlgeriaAngolaAntigua and BarbudaArab WorldArgentinaArmeniaArubaAustraliaAustriaAzerbaijanBahamas, TheBahrainBangladeshBarbadosBelarusBelgiumBelizeBeninBermudaBhutanBoliviaBosnia and HerzegovinaBotswanaBrazilBrunei DarussalamBulgariaBurkina FasoBurundiCabo VerdeCambodiaCameroonCanadaCaribbean small statesCentral African RepublicCentral Europe and the BalticsChadChileChinaColombiaComorosCongo, Dem. Rep.Congo, Rep.Costa RicaCote d'IvoireCroatiaCuracaoCyprusCzech RepublicDenmarkDjiboutiDominicaDominican RepublicEarly-demographic dividendEast Asia & PacificEast Asia & Pacific (excluding high income)East Asia & Pacific (IDA & IBRD countries)EcuadorEgypt, Arab Rep.El SalvadorEquatorial GuineaEritreaEstoniaEthiopiaEuro areaEurope & Central AsiaEurope & Central Asia (excluding high income)Europe & Central Asia (IDA & IBRD countries)European UnionFaroe IslandsFijiFinlandFragile and conflict affected situationsFranceFrench PolynesiaGabonGambia, TheGeorgiaGermanyGhanaGreeceGrenadaGuatemalaGuineaGuinea-BissauGuyanaHaitiHeavily indebted poor countries (HIPC)High incomeHondurasHong Kong SAR, ChinaHungaryIBRD onlyIcelandIDA & IBRD totalIDA blendIDA onlyIDA totalIndiaIndonesiaIran, Islamic Rep.IraqIrelandIsraelItalyJamaicaJapanJordanKazakhstanKenyaKiribatiKorea, Rep.KosovoKuwaitKyrgyz RepublicLao PDRLate-demographic dividendLatin America & Caribbean Latin America & Caribbean (excluding high income)Latin America & the Caribbean (IDA & IBRD countries)LatviaLeast developed countries: UN classificationLebanonLesothoLiberiaLibyaLithuaniaLow & middle incomeLow incomeLower middle incomeLuxembourgMacao SAR, ChinaMacedonia, FYRMadagascarMalawiMalaysiaMaldivesMaliMaltaMarshall IslandsMauritaniaMauritiusMexicoMicronesia, Fed. Sts.Middle East & North Africa (excluding high income)Middle East & North Africa (IDA & IBRD countries)Middle incomeMoldovaMongoliaMontenegroMoroccoMozambiqueMyanmarNamibiaNepalNetherlandsNew CaledoniaNicaraguaNigerNigeriaNorth AmericaNorwayOECD membersOmanOther small statesPacific island small statesPakistanPalauPanamaPapua New GuineaParaguayPeruPhilippinesPolandPortugalPost-demographic dividendPre-demographic dividendQatarRomaniaRussian FederationRwandaSamoaSao Tome and PrincipeSaudi ArabiaSenegalSerbiaSeychellesSierra LeoneSingaporeSint Maarten (Dutch part)Slovak RepublicSloveniaSmall statesSolomon IslandsSouth AfricaSouth AsiaSouth Asia (IDA & IBRD)South SudanSpainSri LankaSt. Kitts and NevisSt. LuciaSt. Vincent and the GrenadinesSub-Saharan Africa Sub-Saharan Africa (excluding high income)Sub-Saharan Africa (IDA & IBRD countries)SudanSurinameSwazilandSwedenSwitzerlandSyrian Arab RepublicTajikistanTanzaniaThailandTimor-LesteTogoTongaTrinidad and TobagoTunisiaTurkeyTuvaluUgandaUkraineUnited KingdomUnited StatesUpper middle incomeUruguayVanuatuVenezuela, RBVietnamWest Bank and GazaWorldYemen, Rep.ZambiaZimbabwe Timeline:
This timeline shows a graph from 1978 to 2016 of Latin America & Caribbean . No data until 1977. Number of actual observations by date: 39.
Source name:
World Development Indicators
Source organization:
International Monetary Fund, Balance of Payments Statistics Yearbook and data files.
Categories, topics:
Economy & Growth, External Debt, Trade
Last updated:
apr 23, 2017
Indicators value changes by year
Minimum:
86.742 bln
jan 1, 1978
Maximum:
1.668 trl
jan 1, 2014
At the date of observation
Value
Absolute change
Change from previous value
jan 1, 1978
86.742 bln
+86.742 bln
0.0%
jan 1, 1979
99.572 bln
+12.83 bln
14.79%
jan 1, 1980
124.898 bln
+25.326 bln
25.43%
jan 1, 1981
170.674 bln
+45.776 bln
36.65%
jan 1, 1982
197.483 bln
+26.809 bln
15.71%
jan 1, 1983
182.237 bln
-15.245 bln
-7.72%
jan 1, 1984
140.922 bln
-41.315 bln
-22.67%
jan 1, 1985
148.251 bln
+7.328 bln
5.2%
jan 1, 1986
145.233 bln
-3.017 bln
-2.04%
jan 1, 1987
143.034 bln
-2.199 bln
-1.51%
jan 1, 1988
149.628 bln
+6.594 bln
4.61%
jan 1, 1989
167.907 bln
+18.279 bln
12.22%
jan 1, 1990
183.841 bln
+15.934 bln
9.49%
jan 1, 1991
200.651 bln
+16.809 bln
9.14%
jan 1, 1992
219.802 bln
+19.151 bln
9.54%
jan 1, 1993
250.157 bln
+30.355 bln
13.81%
jan 1, 1994
276.025 bln
+25.867 bln
10.34%
jan 1, 1995
315.782 bln
+39.757 bln
14.4%
jan 1, 1996
350.716 bln
+34.933 bln
11.06%
jan 1, 1997
379.782 bln
+29.066 bln
8.29%
jan 1, 1998
442.115 bln
+62.333 bln
16.41%
jan 1, 1999
510.227 bln
+68.111 bln
15.41%
jan 1, 2000
489.971 bln
-20.256 bln
-3.97%
jan 1, 2001
561.398 bln
+71.427 bln
14.58%
jan 1, 2002
550.116 bln
-11.282 bln
-2.01%
jan 1, 2003
508.724 bln
-41.392 bln
-7.52%
jan 1, 2004
530.372 bln
+21.648 bln
4.26%
jan 1, 2005
639.577 bln
+109.205 bln
20.59%
jan 1, 2006
761.132 bln
+121.555 bln
19.01%
jan 1, 2007
904.664 bln
+143.531 bln
18.86%
jan 1, 2008
1.081 trl
+176.783 bln
19.54%
jan 1, 2009
1.281 trl
+199.958 bln
18.49%
jan 1, 2010
1.013 trl
-268.513 bln
-20.95%
jan 1, 2011
1.319 trl
+306.414 bln
30.25%
jan 1, 2012
1.605 trl
+285.536 bln
21.64%
jan 1, 2013
1.638 trl
+32.768 bln
2.04%
jan 1, 2014
1.668 trl
+30.881 bln
1.89%
jan 1, 2015
1.668 trl
-216.762 mln
-0.01%
jan 1, 2016
1.481 trl
-187.466 bln
-11.24%
Ranking of countries by current statistics by years


Comments: