29
/
en
AIzaSyAYiBZKx7MnpbEhh9jyipgxe19OcubqV5w
April 1, 2024
55609
Pre-demographic dividend
PRE
false
2
1
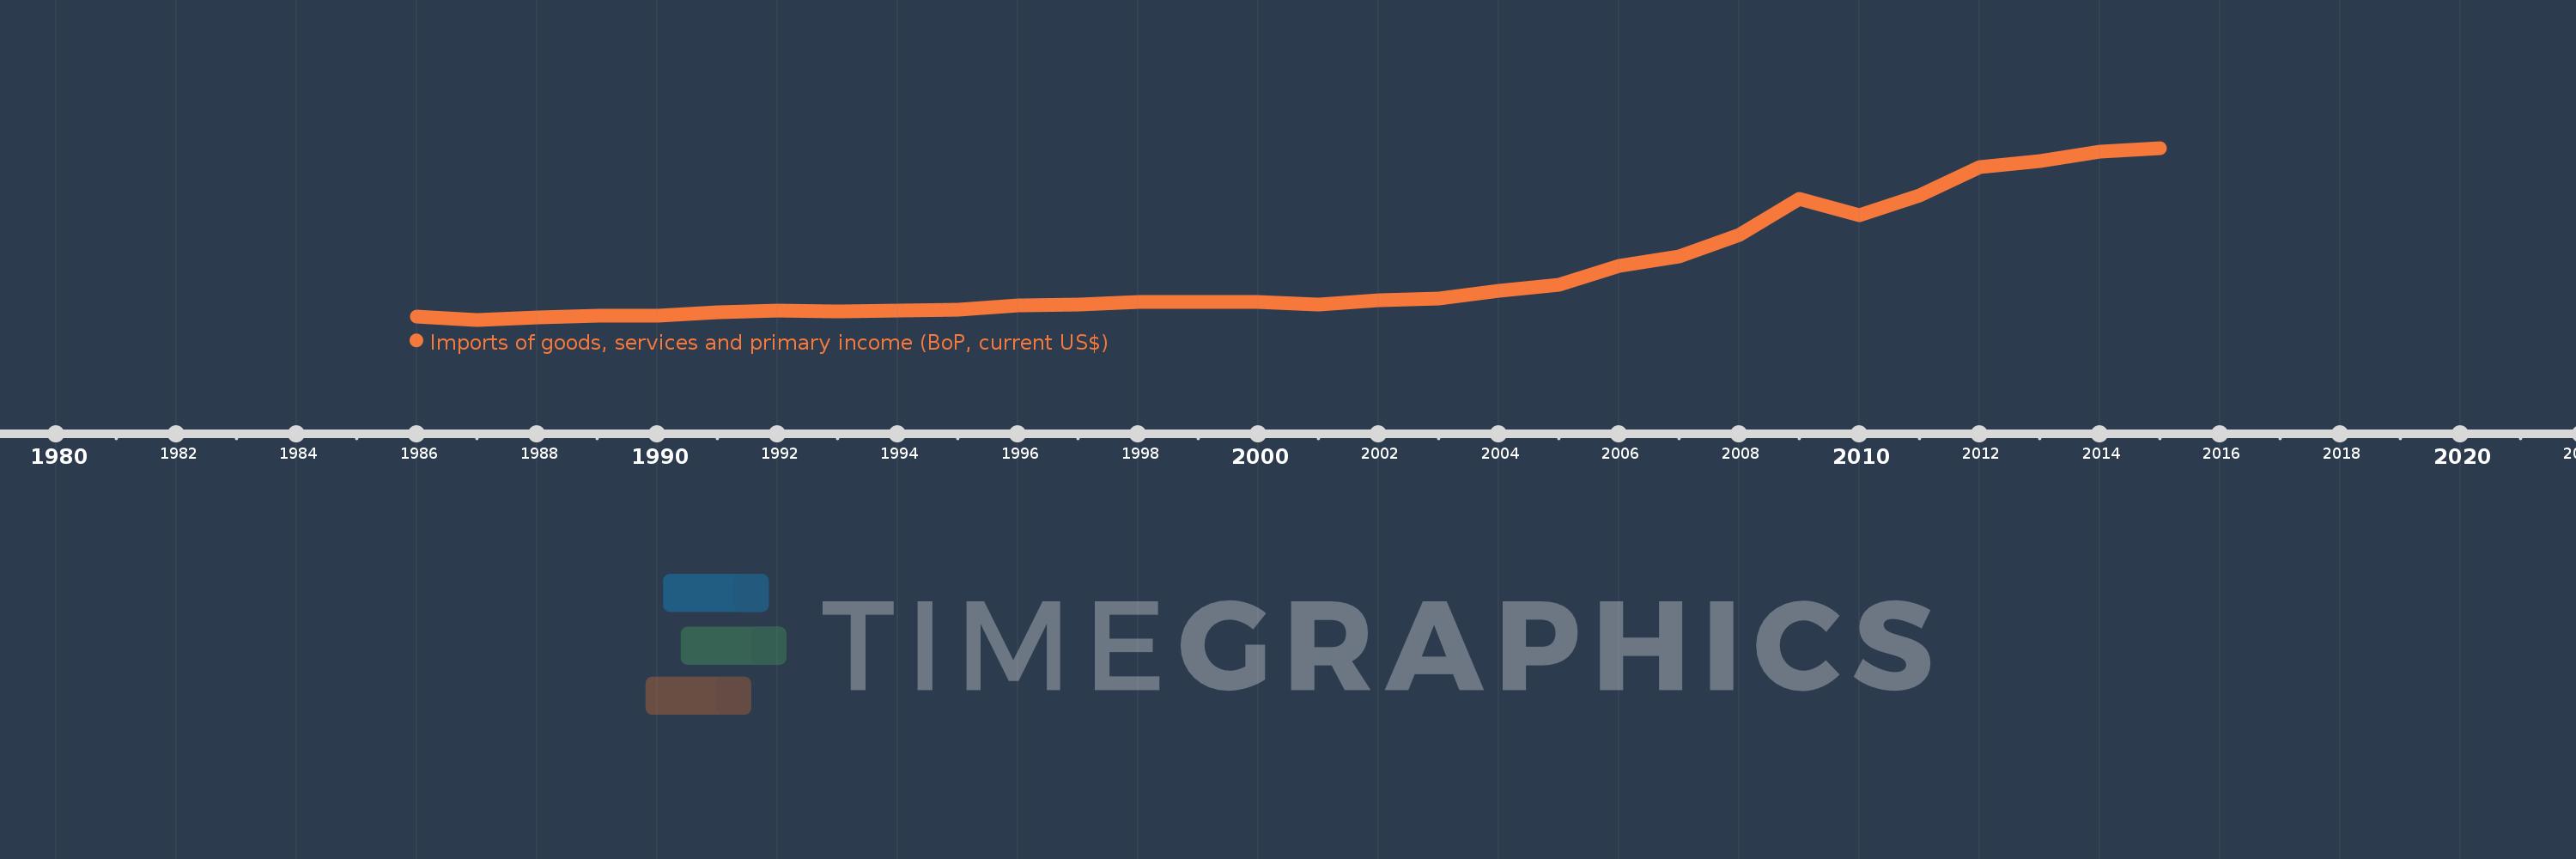
Imports of goods, services and primary income (BoP, current US$)
2015,2014,2013,2012,2011,2010,2009,2008,2007,2006,2005,2004,2003,2002,2001,2000,1999,1998,1997,1996,1995,1994,1993,1992,1991,1990,1989,1988,1987,1986
This statistics in other country:
AfghanistanAlbaniaAlgeriaAngolaAntigua and BarbudaArab WorldArgentinaArmeniaArubaAustraliaAustriaAzerbaijanBahamas, TheBahrainBangladeshBarbadosBelarusBelgiumBelizeBeninBermudaBhutanBoliviaBosnia and HerzegovinaBotswanaBrazilBrunei DarussalamBulgariaBurkina FasoBurundiCabo VerdeCambodiaCameroonCanadaCaribbean small statesCentral African RepublicCentral Europe and the BalticsChadChileChinaColombiaComorosCongo, Dem. Rep.Congo, Rep.Costa RicaCote d'IvoireCroatiaCuracaoCyprusCzech RepublicDenmarkDjiboutiDominicaDominican RepublicEarly-demographic dividendEast Asia & PacificEast Asia & Pacific (excluding high income)East Asia & Pacific (IDA & IBRD countries)EcuadorEgypt, Arab Rep.El SalvadorEquatorial GuineaEritreaEstoniaEthiopiaEuro areaEurope & Central AsiaEurope & Central Asia (excluding high income)Europe & Central Asia (IDA & IBRD countries)European UnionFaroe IslandsFijiFinlandFragile and conflict affected situationsFranceFrench PolynesiaGabonGambia, TheGeorgiaGermanyGhanaGreeceGrenadaGuatemalaGuineaGuinea-BissauGuyanaHaitiHeavily indebted poor countries (HIPC)High incomeHondurasHong Kong SAR, ChinaHungaryIBRD onlyIcelandIDA & IBRD totalIDA blendIDA onlyIDA totalIndiaIndonesiaIran, Islamic Rep.IraqIrelandIsraelItalyJamaicaJapanJordanKazakhstanKenyaKiribatiKorea, Rep.KosovoKuwaitKyrgyz RepublicLao PDRLate-demographic dividendLatin America & Caribbean Latin America & Caribbean (excluding high income)Latin America & the Caribbean (IDA & IBRD countries)LatviaLeast developed countries: UN classificationLebanonLesothoLiberiaLibyaLithuaniaLow & middle incomeLow incomeLower middle incomeLuxembourgMacao SAR, ChinaMacedonia, FYRMadagascarMalawiMalaysiaMaldivesMaliMaltaMarshall IslandsMauritaniaMauritiusMexicoMicronesia, Fed. Sts.Middle East & North Africa (excluding high income)Middle East & North Africa (IDA & IBRD countries)Middle incomeMoldovaMongoliaMontenegroMoroccoMozambiqueMyanmarNamibiaNepalNetherlandsNew CaledoniaNicaraguaNigerNigeriaNorth AmericaNorwayOECD membersOmanOther small statesPacific island small statesPakistanPalauPanamaPapua New GuineaParaguayPeruPhilippinesPolandPortugalPost-demographic dividendPre-demographic dividendQatarRomaniaRussian FederationRwandaSamoaSao Tome and PrincipeSaudi ArabiaSenegalSerbiaSeychellesSierra LeoneSingaporeSint Maarten (Dutch part)Slovak RepublicSloveniaSmall statesSolomon IslandsSouth AfricaSouth AsiaSouth Asia (IDA & IBRD)South SudanSpainSri LankaSt. Kitts and NevisSt. LuciaSt. Vincent and the GrenadinesSub-Saharan Africa Sub-Saharan Africa (excluding high income)Sub-Saharan Africa (IDA & IBRD countries)SudanSurinameSwazilandSwedenSwitzerlandSyrian Arab RepublicTajikistanTanzaniaThailandTimor-LesteTogoTongaTrinidad and TobagoTunisiaTurkeyTuvaluUgandaUkraineUnited KingdomUnited StatesUpper middle incomeUruguayVanuatuVenezuela, RBVietnamWest Bank and GazaWorldYemen, Rep.ZambiaZimbabwe Timeline:
This timeline shows a graph from 1986 to 2015 of Pre-demographic dividend. No data until 1985. Number of actual observations by date: 30.
Source name:
World Development Indicators
Source organization:
International Monetary Fund, Balance of Payments Statistics Yearbook and data files.
Categories, topics:
Economy & Growth, External Debt, Trade
Last updated:
apr 23, 2017
Indicators value changes by year
Minimum:
39.074 bln
jan 1, 1987
Maximum:
456.276 bln
jan 1, 2015
At the date of observation
Value
Absolute change
Change from previous value
jan 1, 1986
46.087 bln
+46.087 bln
0.0%
jan 1, 1987
39.074 bln
-7.012 bln
-15.22%
jan 1, 1988
45.003 bln
+5.929 bln
15.17%
jan 1, 1989
47.97 bln
+2.968 bln
6.59%
jan 1, 1990
48.804 bln
+833.233 mln
1.74%
jan 1, 1991
57.766 bln
+8.963 bln
18.36%
jan 1, 1992
61.506 bln
+3.74 bln
6.47%
jan 1, 1993
59.593 bln
-1.914 bln
-3.11%
jan 1, 1994
62.281 bln
+2.688 bln
4.51%
jan 1, 1995
63.014 bln
+733.029 mln
1.18%
jan 1, 1996
73.241 bln
+10.228 bln
16.23%
jan 1, 1997
76.161 bln
+2.919 bln
3.99%
jan 1, 1998
82.515 bln
+6.354 bln
8.34%
jan 1, 1999
82.067 bln
-448.698 mln
-0.54%
jan 1, 2000
81.503 bln
-563.417 mln
-0.69%
jan 1, 2001
76.86 bln
-4.644 bln
-5.7%
jan 1, 2002
86.891 bln
+10.031 bln
13.05%
jan 1, 2003
91.541 bln
+4.65 bln
5.35%
jan 1, 2004
110.327 bln
+18.786 bln
20.52%
jan 1, 2005
123.812 bln
+13.485 bln
12.22%
jan 1, 2006
168.927 bln
+45.115 bln
36.44%
jan 1, 2007
192.274 bln
+23.348 bln
13.82%
jan 1, 2008
243.929 bln
+51.655 bln
26.87%
jan 1, 2009
331.952 bln
+88.023 bln
36.09%
jan 1, 2010
293.486 bln
-38.467 bln
-11.59%
jan 1, 2011
341.444 bln
+47.959 bln
16.34%
jan 1, 2012
410.03 bln
+68.586 bln
20.09%
jan 1, 2013
424.35 bln
+14.319 bln
3.49%
jan 1, 2014
446.962 bln
+22.613 bln
5.33%
jan 1, 2015
456.276 bln
+9.314 bln
2.08%
Ranking of countries by current statistics by years


Comments: