29
/
en
AIzaSyAYiBZKx7MnpbEhh9jyipgxe19OcubqV5w
April 1, 2024
132114
Fiji
FJI
true
2
1
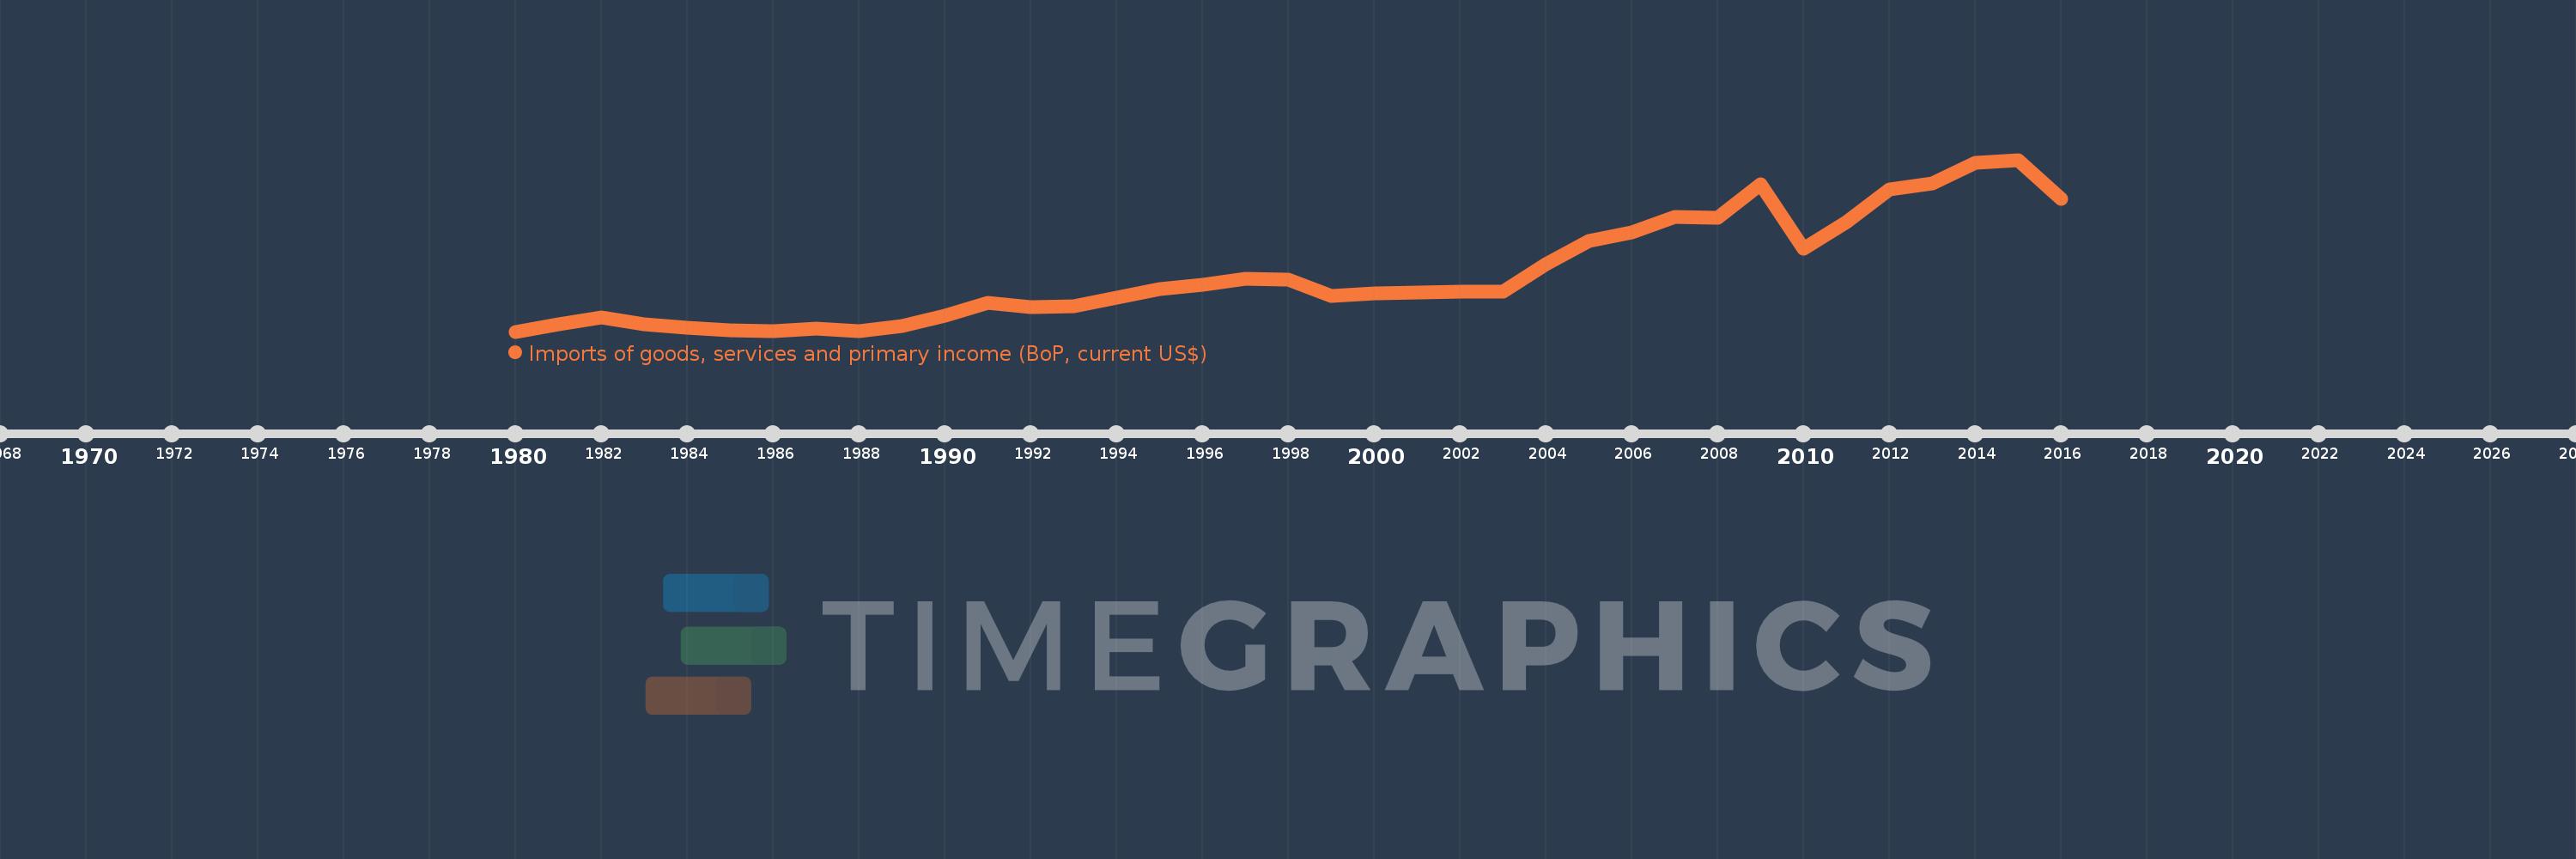
Imports of goods, services and primary income (BoP, current US$)
2016,2015,2014,2013,2012,2011,2010,2009,2008,2007,2006,2005,2004,2003,2002,2001,2000,1999,1998,1997,1996,1995,1994,1993,1992,1991,1990,1989,1988,1987,1986,1985,1984,1983,1982,1981,1980
This statistics in other country:
AfghanistanAlbaniaAlgeriaAngolaAntigua and BarbudaArab WorldArgentinaArmeniaArubaAustraliaAustriaAzerbaijanBahamas, TheBahrainBangladeshBarbadosBelarusBelgiumBelizeBeninBermudaBhutanBoliviaBosnia and HerzegovinaBotswanaBrazilBrunei DarussalamBulgariaBurkina FasoBurundiCabo VerdeCambodiaCameroonCanadaCaribbean small statesCentral African RepublicCentral Europe and the BalticsChadChileChinaColombiaComorosCongo, Dem. Rep.Congo, Rep.Costa RicaCote d'IvoireCroatiaCuracaoCyprusCzech RepublicDenmarkDjiboutiDominicaDominican RepublicEarly-demographic dividendEast Asia & PacificEast Asia & Pacific (excluding high income)East Asia & Pacific (IDA & IBRD countries)EcuadorEgypt, Arab Rep.El SalvadorEquatorial GuineaEritreaEstoniaEthiopiaEuro areaEurope & Central AsiaEurope & Central Asia (excluding high income)Europe & Central Asia (IDA & IBRD countries)European UnionFaroe IslandsFijiFinlandFragile and conflict affected situationsFranceFrench PolynesiaGabonGambia, TheGeorgiaGermanyGhanaGreeceGrenadaGuatemalaGuineaGuinea-BissauGuyanaHaitiHeavily indebted poor countries (HIPC)High incomeHondurasHong Kong SAR, ChinaHungaryIBRD onlyIcelandIDA & IBRD totalIDA blendIDA onlyIDA totalIndiaIndonesiaIran, Islamic Rep.IraqIrelandIsraelItalyJamaicaJapanJordanKazakhstanKenyaKiribatiKorea, Rep.KosovoKuwaitKyrgyz RepublicLao PDRLate-demographic dividendLatin America & Caribbean Latin America & Caribbean (excluding high income)Latin America & the Caribbean (IDA & IBRD countries)LatviaLeast developed countries: UN classificationLebanonLesothoLiberiaLibyaLithuaniaLow & middle incomeLow incomeLower middle incomeLuxembourgMacao SAR, ChinaMacedonia, FYRMadagascarMalawiMalaysiaMaldivesMaliMaltaMarshall IslandsMauritaniaMauritiusMexicoMicronesia, Fed. Sts.Middle East & North Africa (excluding high income)Middle East & North Africa (IDA & IBRD countries)Middle incomeMoldovaMongoliaMontenegroMoroccoMozambiqueMyanmarNamibiaNepalNetherlandsNew CaledoniaNicaraguaNigerNigeriaNorth AmericaNorwayOECD membersOmanOther small statesPacific island small statesPakistanPalauPanamaPapua New GuineaParaguayPeruPhilippinesPolandPortugalPost-demographic dividendPre-demographic dividendQatarRomaniaRussian FederationRwandaSamoaSao Tome and PrincipeSaudi ArabiaSenegalSerbiaSeychellesSierra LeoneSingaporeSint Maarten (Dutch part)Slovak RepublicSloveniaSmall statesSolomon IslandsSouth AfricaSouth AsiaSouth Asia (IDA & IBRD)South SudanSpainSri LankaSt. Kitts and NevisSt. LuciaSt. Vincent and the GrenadinesSub-Saharan Africa Sub-Saharan Africa (excluding high income)Sub-Saharan Africa (IDA & IBRD countries)SudanSurinameSwazilandSwedenSwitzerlandSyrian Arab RepublicTajikistanTanzaniaThailandTimor-LesteTogoTongaTrinidad and TobagoTunisiaTurkeyTuvaluUgandaUkraineUnited KingdomUnited StatesUpper middle incomeUruguayVanuatuVenezuela, RBVietnamWest Bank and GazaWorldYemen, Rep.ZambiaZimbabwe Timeline:
This timeline shows a graph from 1980 to 2016 of Fiji. No data until 1979. Number of actual observations by date: 37.
Source name:
World Development Indicators
Source organization:
International Monetary Fund, Balance of Payments Statistics Yearbook and data files.
Categories, topics:
Economy & Growth, External Debt, Trade
Last updated:
apr 23, 2017
Indicators value changes by year
Minimum:
546.819 mln
jan 1, 1980
Maximum:
3.126 bln
jan 1, 2015
At the date of observation
Value
Absolute change
Change from previous value
jan 1, 1980
546.819 mln
+546.819 mln
0.0%
jan 1, 1981
656.569 mln
+109.75 mln
20.07%
jan 1, 1982
754.458 mln
+97.889 mln
14.91%
jan 1, 1983
654.352 mln
-100.106 mln
-13.27%
jan 1, 1984
600.814 mln
-53.538 mln
-8.18%
jan 1, 1985
568.152 mln
-32.661 mln
-5.44%
jan 1, 1986
558.361 mln
-9.791 mln
-1.72%
jan 1, 1987
586.301 mln
+27.939 mln
5.0%
jan 1, 1988
547.812 mln
-38.489 mln
-6.56%
jan 1, 1989
633.941 mln
+86.13 mln
15.72%
jan 1, 1990
791.056 mln
+157.115 mln
24.78%
jan 1, 1991
974.267 mln
+183.211 mln
23.16%
jan 1, 1992
910.91 mln
-63.357 mln
-6.5%
jan 1, 1993
922.228 mln
+11.318 mln
1.24%
jan 1, 1994
1.054 bln
+132.076 mln
14.32%
jan 1, 1995
1.191 bln
+137.056 mln
13.0%
jan 1, 1996
1.255 bln
+63.321 mln
5.32%
jan 1, 1997
1.344 bln
+89.721 mln
7.15%
jan 1, 1998
1.324 bln
-20.697 mln
-1.54%
jan 1, 1999
1.077 bln
-246.555 mln
-18.63%
jan 1, 2000
1.126 bln
+48.749 mln
4.53%
jan 1, 2001
1.135 bln
+8.858 mln
0.79%
jan 1, 2002
1.146 bln
+10.982 mln
0.97%
jan 1, 2003
1.146 bln
-48.43K
0.0%
jan 1, 2004
1.554 bln
+408.732 mln
35.68%
jan 1, 2005
1.907 bln
+352.762 mln
22.69%
jan 1, 2006
2.039 bln
+131.46 mln
6.89%
jan 1, 2007
2.268 bln
+229.547 mln
11.26%
jan 1, 2008
2.255 bln
-13.345 mln
-0.59%
jan 1, 2009
2.765 bln
+509.686 mln
22.6%
jan 1, 2010
1.785 bln
-979.262 mln
-35.42%
jan 1, 2011
2.186 bln
+401.023 mln
22.46%
jan 1, 2012
2.679 bln
+493.026 mln
22.55%
jan 1, 2013
2.771 bln
+91.92 mln
3.43%
jan 1, 2014
3.077 bln
+306.142 mln
11.05%
jan 1, 2015
3.126 bln
+48.227 mln
1.57%
jan 1, 2016
2.54 bln
-585.245 mln
-18.72%
Ranking of countries by current statistics by years


Comments: