29
/
en
AIzaSyAYiBZKx7MnpbEhh9jyipgxe19OcubqV5w
April 1, 2024
76735
Bahamas, The
BHS
true
2
1
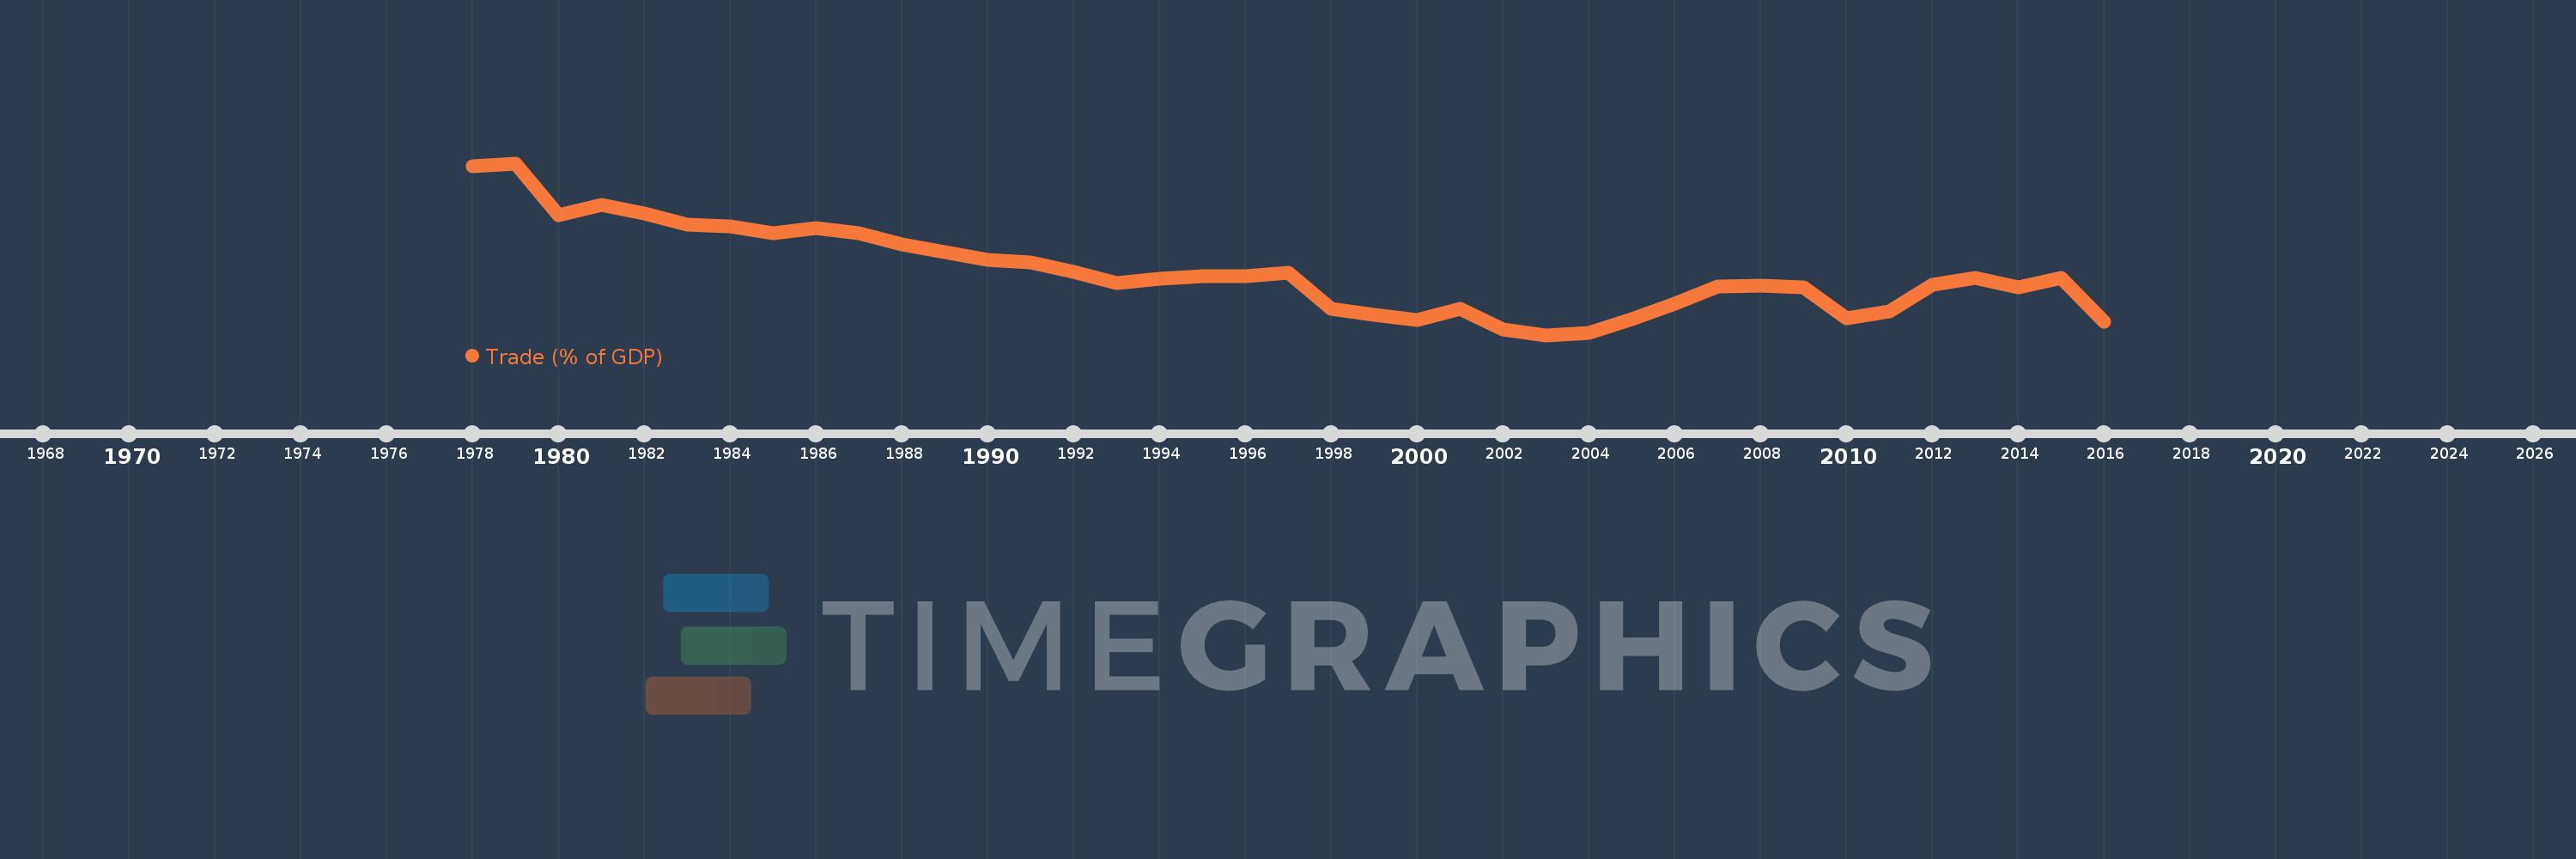
Trade (% of GDP)
2016,2015,2014,2013,2012,2011,2010,2009,2008,2007,2006,2005,2004,2003,2002,2001,2000,1999,1998,1997,1996,1995,1994,1993,1992,1991,1990,1988,1987,1986,1985,1984,1983,1982,1981,1980,1979,1978
This statistics in other country:
AfghanistanAlbaniaAlgeriaAngolaAntigua and BarbudaArab WorldArgentinaArmeniaArubaAustraliaAustriaAzerbaijanBahamas, TheBahrainBangladeshBarbadosBelarusBelgiumBelizeBeninBermudaBhutanBoliviaBosnia and HerzegovinaBotswanaBrazilBrunei DarussalamBulgariaBurkina FasoBurundiCabo VerdeCambodiaCameroonCanadaCaribbean small statesCentral African RepublicCentral Europe and the BalticsChadChileChinaColombiaComorosCongo, Dem. Rep.Congo, Rep.Costa RicaCote d'IvoireCroatiaCubaCyprusCzech RepublicDenmarkDjiboutiDominicaDominican RepublicEarly-demographic dividendEast Asia & PacificEast Asia & Pacific (excluding high income)East Asia & Pacific (IDA & IBRD countries)EcuadorEgypt, Arab Rep.El SalvadorEquatorial GuineaEritreaEstoniaEthiopiaEuro areaEurope & Central AsiaEurope & Central Asia (excluding high income)Europe & Central Asia (IDA & IBRD countries)European UnionFaroe IslandsFijiFinlandFragile and conflict affected situationsFranceFrench PolynesiaGabonGambia, TheGeorgiaGermanyGhanaGreeceGrenadaGuatemalaGuineaGuinea-BissauGuyanaHaitiHeavily indebted poor countries (HIPC)High incomeHondurasHong Kong SAR, ChinaHungaryIBRD onlyIcelandIDA & IBRD totalIDA blendIDA onlyIDA totalIndiaIndonesiaIran, Islamic Rep.IraqIrelandIsraelItalyJamaicaJapanJordanKazakhstanKenyaKiribatiKorea, Rep.KosovoKuwaitKyrgyz RepublicLao PDRLate-demographic dividendLatin America & Caribbean Latin America & Caribbean (excluding high income)Latin America & the Caribbean (IDA & IBRD countries)LatviaLeast developed countries: UN classificationLebanonLesothoLiberiaLibyaLithuaniaLow & middle incomeLow incomeLower middle incomeLuxembourgMacao SAR, ChinaMacedonia, FYRMadagascarMalawiMalaysiaMaldivesMaliMaltaMauritaniaMauritiusMexicoMicronesia, Fed. Sts.Middle East & North AfricaMiddle East & North Africa (excluding high income)Middle East & North Africa (IDA & IBRD countries)Middle incomeMoldovaMongoliaMontenegroMoroccoMozambiqueMyanmarNamibiaNepalNetherlandsNew CaledoniaNew ZealandNicaraguaNigerNigeriaNorth AmericaNorwayOECD membersOmanOther small statesPacific island small statesPakistanPalauPanamaPapua New GuineaParaguayPeruPhilippinesPolandPortugalPost-demographic dividendPre-demographic dividendPuerto RicoQatarRomaniaRussian FederationRwandaSamoaSaudi ArabiaSenegalSerbiaSeychellesSierra LeoneSingaporeSlovak RepublicSloveniaSmall statesSolomon IslandsSomaliaSouth AfricaSouth AsiaSouth Asia (IDA & IBRD)South SudanSpainSri LankaSt. Kitts and NevisSt. LuciaSt. Vincent and the GrenadinesSub-Saharan Africa Sub-Saharan Africa (excluding high income)Sub-Saharan Africa (IDA & IBRD countries)SudanSurinameSwazilandSwedenSwitzerlandSyrian Arab RepublicTajikistanTanzaniaThailandTimor-LesteTogoTongaTrinidad and TobagoTunisiaTurkeyTurkmenistanUgandaUkraineUnited Arab EmiratesUnited KingdomUnited StatesUpper middle incomeUruguayUzbekistanVanuatuVenezuela, RBVietnamWest Bank and GazaWorldYemen, Rep.ZambiaZimbabwe Timeline:
This timeline shows a graph from 1978 to 2016 of Bahamas, The. No data until 1977. Number of actual observations by date: 38.
Source name:
World Development Indicators
Source organization:
World Bank national accounts data, and OECD National Accounts data files.
Categories, topics:
Economy & Growth, Trade
Last updated:
apr 23, 2017
Indicators value changes by year
Minimum:
80.578
jan 1, 2003
Maximum:
150.18
jan 1, 1979
At the date of observation
Value
Absolute change
Change from previous value
jan 1, 1978
148.794
+148.794
0.0%
jan 1, 1979
150.18
+1.386
0.93%
jan 1, 1980
129.075
-21.105
-14.05%
jan 1, 1981
133.258
+4.183
3.24%
jan 1, 1982
129.751
-3.507
-2.63%
jan 1, 1983
125.337
-4.414
-3.4%
jan 1, 1984
124.584
-0.753
-0.6%
jan 1, 1985
121.895
-2.689
-2.16%
jan 1, 1986
124.062
+2.167
1.78%
jan 1, 1987
121.723
-2.339
-1.89%
jan 1, 1988
117.126
-4.597
-3.78%
jan 1, 1990
111.0
-6.126
-5.23%
jan 1, 1991
110.12
-0.88
-0.79%
jan 1, 1992
106.119
-4.001
-3.63%
jan 1, 1993
101.462
-4.657
-4.39%
jan 1, 1994
103.36
+1.898
1.87%
jan 1, 1995
104.402
+1.042
1.01%
jan 1, 1996
104.465
+0.063
0.06%
jan 1, 1997
105.857
+1.391
1.33%
jan 1, 1998
91.257
-14.6
-13.79%
jan 1, 1999
88.906
-2.351
-2.58%
jan 1, 2000
86.699
-2.207
-2.48%
jan 1, 2001
91.201
+4.503
5.19%
jan 1, 2002
82.997
-8.204
-9.0%
jan 1, 2003
80.578
-2.419
-2.91%
jan 1, 2004
81.448
+0.87
1.08%
jan 1, 2005
87.106
+5.657
6.95%
jan 1, 2006
93.201
+6.096
7.0%
jan 1, 2007
100.115
+6.913
7.42%
jan 1, 2008
100.705
+0.59
0.59%
jan 1, 2009
100.024
-0.681
-0.68%
jan 1, 2010
87.531
-12.493
-12.49%
jan 1, 2011
89.987
+2.456
2.81%
jan 1, 2012
100.962
+10.975
12.2%
jan 1, 2013
103.711
+2.749
2.72%
jan 1, 2014
100.006
-3.705
-3.57%
jan 1, 2015
103.792
+3.786
3.79%
jan 1, 2016
85.815
-17.977
-17.32%
Ranking of countries by current statistics by years


Comments: