29
/
en
AIzaSyAYiBZKx7MnpbEhh9jyipgxe19OcubqV5w
April 1, 2024
52308
North America
NAC
false
2
1
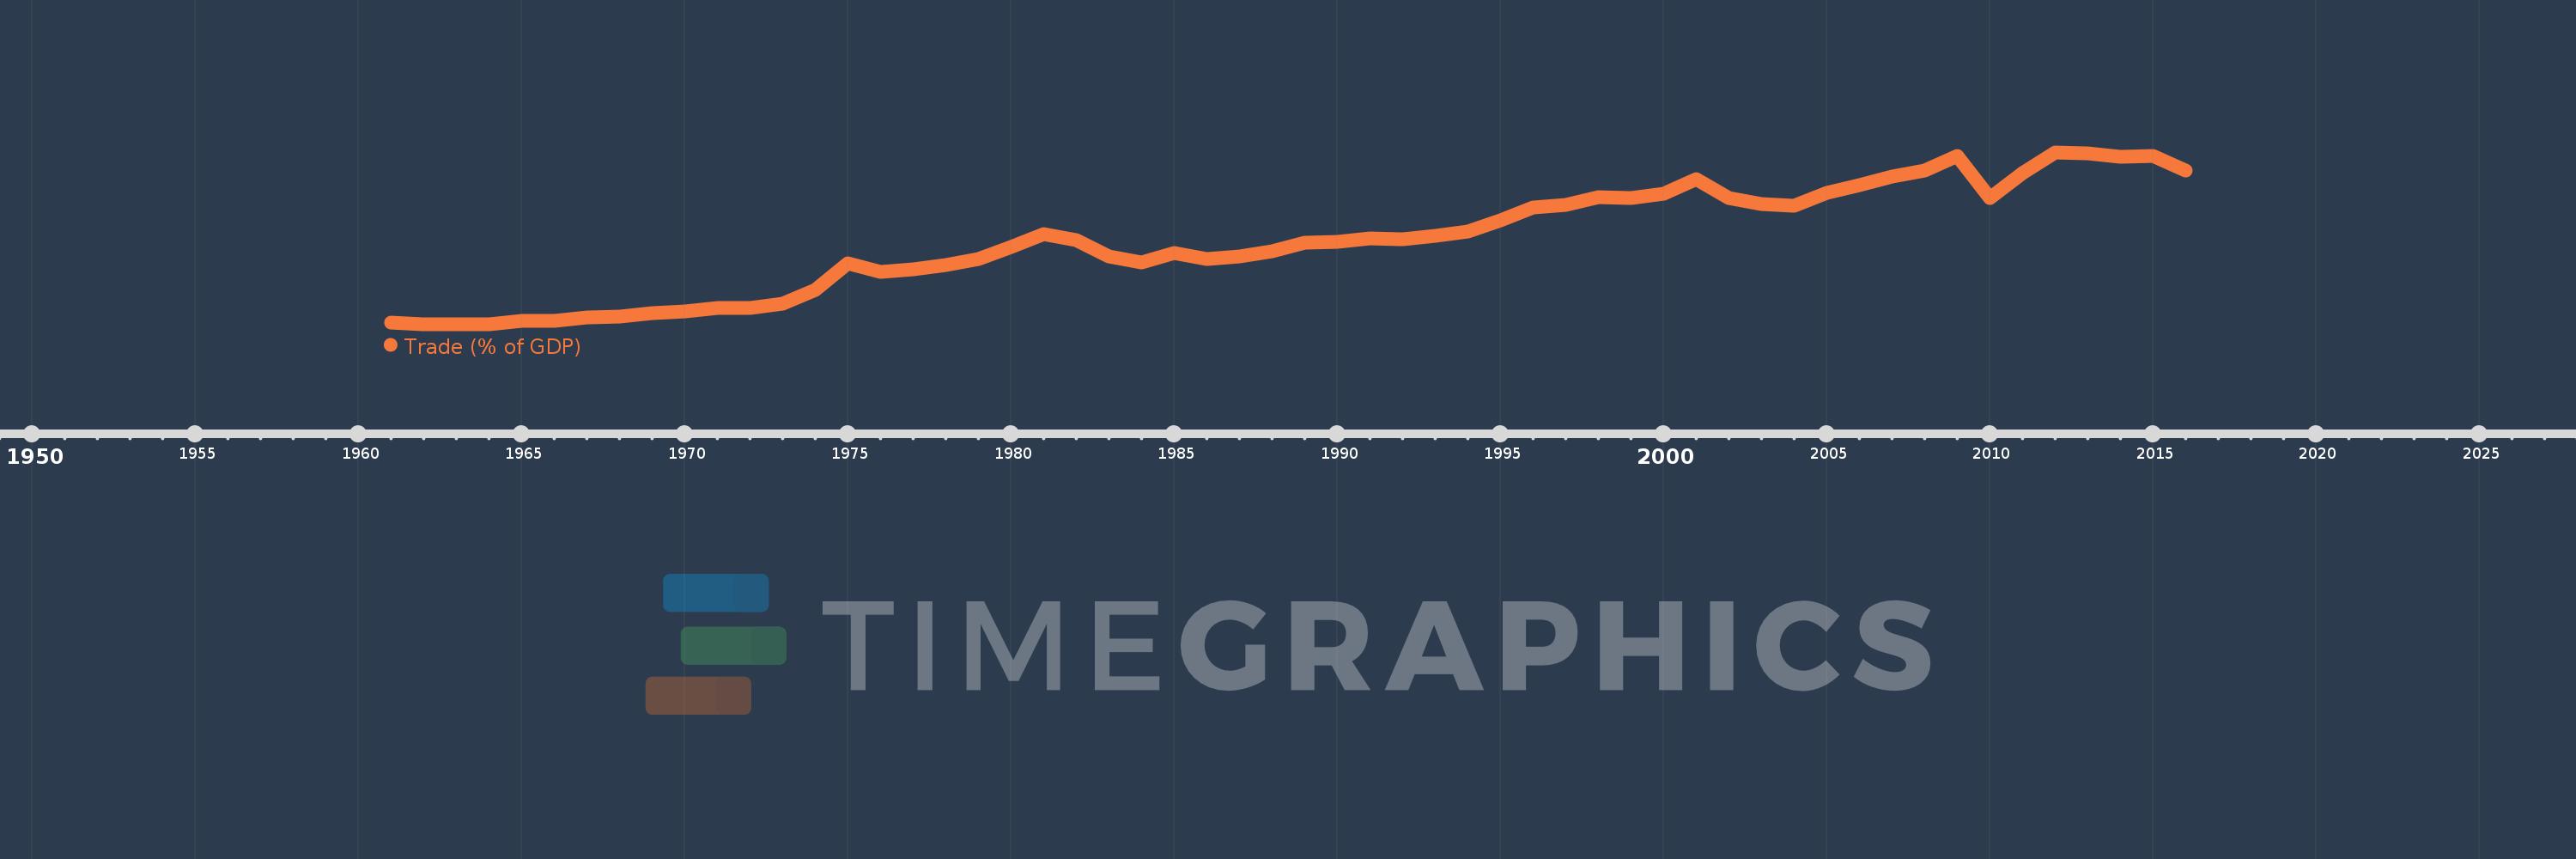
Trade (% of GDP)
2016,2015,2014,2013,2012,2011,2010,2009,2008,2007,2006,2005,2004,2003,2002,2001,2000,1999,1998,1997,1996,1995,1994,1993,1992,1991,1990,1989,1988,1987,1986,1985,1984,1983,1982,1981,1980,1979,1978,1977,1976,1975,1974,1973,1972,1971,1970,1969,1968,1967,1966,1965,1964,1963,1962,1961
This statistics in other country:
AfghanistanAlbaniaAlgeriaAngolaAntigua and BarbudaArab WorldArgentinaArmeniaArubaAustraliaAustriaAzerbaijanBahamas, TheBahrainBangladeshBarbadosBelarusBelgiumBelizeBeninBermudaBhutanBoliviaBosnia and HerzegovinaBotswanaBrazilBrunei DarussalamBulgariaBurkina FasoBurundiCabo VerdeCambodiaCameroonCanadaCaribbean small statesCentral African RepublicCentral Europe and the BalticsChadChileChinaColombiaComorosCongo, Dem. Rep.Congo, Rep.Costa RicaCote d'IvoireCroatiaCubaCyprusCzech RepublicDenmarkDjiboutiDominicaDominican RepublicEarly-demographic dividendEast Asia & PacificEast Asia & Pacific (excluding high income)East Asia & Pacific (IDA & IBRD countries)EcuadorEgypt, Arab Rep.El SalvadorEquatorial GuineaEritreaEstoniaEthiopiaEuro areaEurope & Central AsiaEurope & Central Asia (excluding high income)Europe & Central Asia (IDA & IBRD countries)European UnionFaroe IslandsFijiFinlandFragile and conflict affected situationsFranceFrench PolynesiaGabonGambia, TheGeorgiaGermanyGhanaGreeceGrenadaGuatemalaGuineaGuinea-BissauGuyanaHaitiHeavily indebted poor countries (HIPC)High incomeHondurasHong Kong SAR, ChinaHungaryIBRD onlyIcelandIDA & IBRD totalIDA blendIDA onlyIDA totalIndiaIndonesiaIran, Islamic Rep.IraqIrelandIsraelItalyJamaicaJapanJordanKazakhstanKenyaKiribatiKorea, Rep.KosovoKuwaitKyrgyz RepublicLao PDRLate-demographic dividendLatin America & Caribbean Latin America & Caribbean (excluding high income)Latin America & the Caribbean (IDA & IBRD countries)LatviaLeast developed countries: UN classificationLebanonLesothoLiberiaLibyaLithuaniaLow & middle incomeLow incomeLower middle incomeLuxembourgMacao SAR, ChinaMacedonia, FYRMadagascarMalawiMalaysiaMaldivesMaliMaltaMauritaniaMauritiusMexicoMicronesia, Fed. Sts.Middle East & North AfricaMiddle East & North Africa (excluding high income)Middle East & North Africa (IDA & IBRD countries)Middle incomeMoldovaMongoliaMontenegroMoroccoMozambiqueMyanmarNamibiaNepalNetherlandsNew CaledoniaNew ZealandNicaraguaNigerNigeriaNorth AmericaNorwayOECD membersOmanOther small statesPacific island small statesPakistanPalauPanamaPapua New GuineaParaguayPeruPhilippinesPolandPortugalPost-demographic dividendPre-demographic dividendPuerto RicoQatarRomaniaRussian FederationRwandaSamoaSaudi ArabiaSenegalSerbiaSeychellesSierra LeoneSingaporeSlovak RepublicSloveniaSmall statesSolomon IslandsSomaliaSouth AfricaSouth AsiaSouth Asia (IDA & IBRD)South SudanSpainSri LankaSt. Kitts and NevisSt. LuciaSt. Vincent and the GrenadinesSub-Saharan Africa Sub-Saharan Africa (excluding high income)Sub-Saharan Africa (IDA & IBRD countries)SudanSurinameSwazilandSwedenSwitzerlandSyrian Arab RepublicTajikistanTanzaniaThailandTimor-LesteTogoTongaTrinidad and TobagoTunisiaTurkeyTurkmenistanUgandaUkraineUnited Arab EmiratesUnited KingdomUnited StatesUpper middle incomeUruguayUzbekistanVanuatuVenezuela, RBVietnamWest Bank and GazaWorldYemen, Rep.ZambiaZimbabwe Timeline:
This timeline shows a graph from 1961 to 2016 of North America. No data until 1960. Number of actual observations by date: 56.
Source name:
World Development Indicators
Source organization:
World Bank national accounts data, and OECD National Accounts data files.
Categories, topics:
Economy & Growth, Trade
Last updated:
apr 23, 2017
Indicators value changes by year
Minimum:
11.358
jan 1, 1963
Maximum:
33.757
jan 1, 2012
At the date of observation
Value
Absolute change
Change from previous value
jan 1, 1961
11.52
+11.52
0.0%
jan 1, 1962
11.369
-0.151
-1.31%
jan 1, 1963
11.358
-0.011
-0.09%
jan 1, 1964
11.384
+0.026
0.23%
jan 1, 1965
11.755
+0.371
3.25%
jan 1, 1966
11.762
+0.007
0.06%
jan 1, 1967
12.209
+0.447
3.8%
jan 1, 1968
12.387
+0.178
1.46%
jan 1, 1969
12.854
+0.467
3.77%
jan 1, 1970
12.976
+0.122
0.95%
jan 1, 1971
13.507
+0.531
4.09%
jan 1, 1972
13.43
-0.077
-0.57%
jan 1, 1973
14.064
+0.634
4.72%
jan 1, 1974
15.869
+1.805
12.84%
jan 1, 1975
19.272
+3.402
21.44%
jan 1, 1976
18.226
-1.045
-5.42%
jan 1, 1977
18.568
+0.342
1.88%
jan 1, 1978
19.043
+0.475
2.56%
jan 1, 1979
19.828
+0.785
4.12%
jan 1, 1980
21.416
+1.588
8.01%
jan 1, 1981
23.088
+1.673
7.81%
jan 1, 1982
22.371
-0.717
-3.11%
jan 1, 1983
20.169
-2.202
-9.84%
jan 1, 1984
19.373
-0.796
-3.94%
jan 1, 1985
20.682
+1.309
6.76%
jan 1, 1986
19.867
-0.815
-3.94%
jan 1, 1987
20.147
+0.279
1.41%
jan 1, 1988
20.909
+0.762
3.78%
jan 1, 1989
21.947
+1.039
4.97%
jan 1, 1990
22.145
+0.198
0.9%
jan 1, 1991
22.502
+0.357
1.61%
jan 1, 1992
22.41
-0.092
-0.41%
jan 1, 1993
22.872
+0.462
2.06%
jan 1, 1994
23.458
+0.586
2.56%
jan 1, 1995
24.933
+1.475
6.29%
jan 1, 1996
26.622
+1.689
6.77%
jan 1, 1997
26.939
+0.317
1.19%
jan 1, 1998
27.976
+1.037
3.85%
jan 1, 1999
27.787
-0.189
-0.68%
jan 1, 2000
28.366
+0.579
2.08%
jan 1, 2001
30.236
+1.869
6.59%
jan 1, 2002
27.849
-2.386
-7.89%
jan 1, 2003
27.013
-0.837
-3.0%
jan 1, 2004
26.752
-0.261
-0.97%
jan 1, 2005
28.459
+1.708
6.38%
jan 1, 2006
29.513
+1.054
3.7%
jan 1, 2007
30.604
+1.091
3.7%
jan 1, 2008
31.429
+0.824
2.69%
jan 1, 2009
33.298
+1.869
5.95%
jan 1, 2010
27.835
-5.463
-16.41%
jan 1, 2011
31.095
+3.261
11.71%
jan 1, 2012
33.757
+2.662
8.56%
jan 1, 2013
33.608
-0.149
-0.44%
jan 1, 2014
33.142
-0.466
-1.39%
jan 1, 2015
33.325
+0.183
0.55%
jan 1, 2016
31.394
-1.931
-5.8%
Ranking of countries by current statistics by years


Comments: