29
/
en
AIzaSyAYiBZKx7MnpbEhh9jyipgxe19OcubqV5w
April 1, 2024
212464
Niger
NER
true
2
1
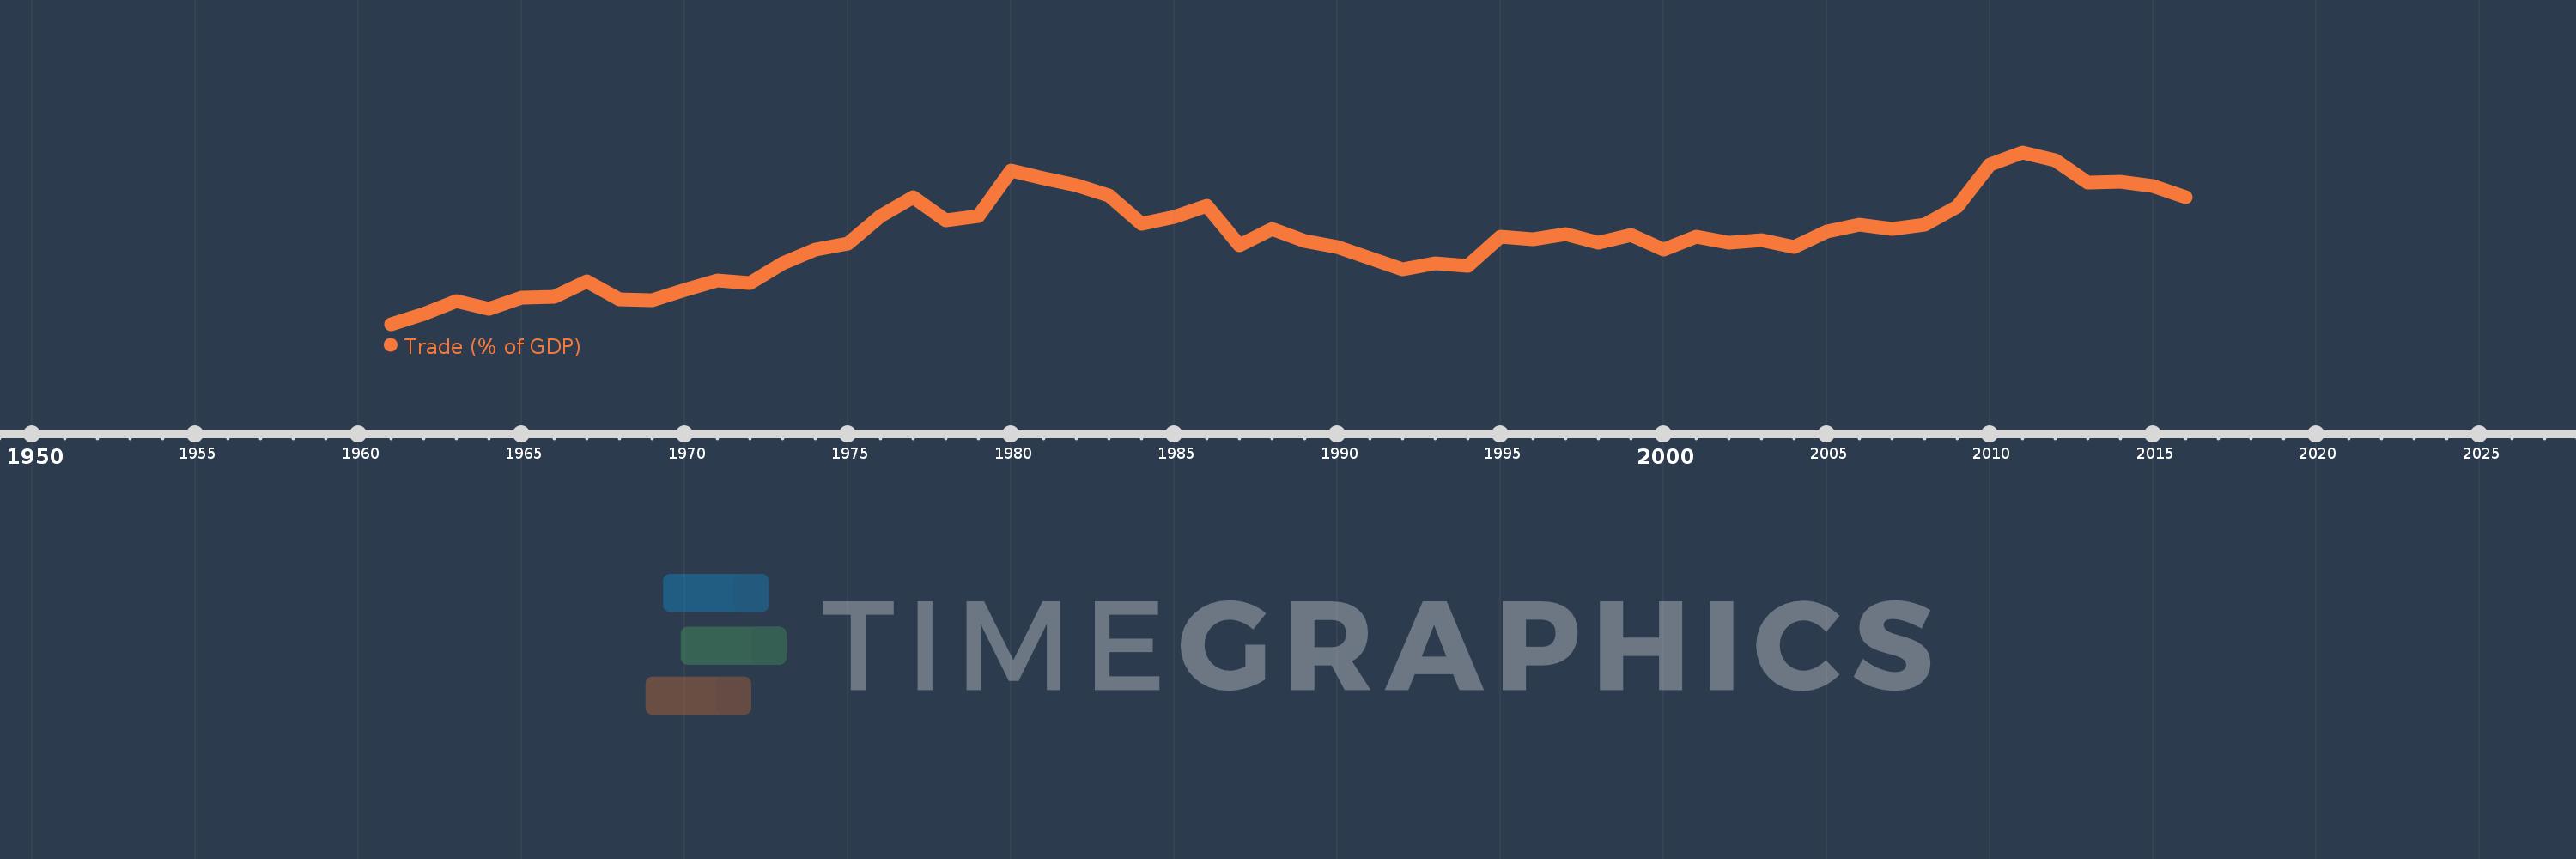
Trade (% of GDP)
2016,2015,2014,2013,2012,2011,2010,2009,2008,2007,2006,2005,2004,2003,2002,2001,2000,1999,1998,1997,1996,1995,1994,1993,1992,1991,1990,1989,1988,1987,1986,1985,1984,1983,1982,1981,1980,1979,1978,1977,1976,1975,1974,1973,1972,1971,1970,1969,1968,1967,1966,1965,1964,1963,1962,1961
This statistics in other country:
AfghanistanAlbaniaAlgeriaAngolaAntigua and BarbudaArab WorldArgentinaArmeniaArubaAustraliaAustriaAzerbaijanBahamas, TheBahrainBangladeshBarbadosBelarusBelgiumBelizeBeninBermudaBhutanBoliviaBosnia and HerzegovinaBotswanaBrazilBrunei DarussalamBulgariaBurkina FasoBurundiCabo VerdeCambodiaCameroonCanadaCaribbean small statesCentral African RepublicCentral Europe and the BalticsChadChileChinaColombiaComorosCongo, Dem. Rep.Congo, Rep.Costa RicaCote d'IvoireCroatiaCubaCyprusCzech RepublicDenmarkDjiboutiDominicaDominican RepublicEarly-demographic dividendEast Asia & PacificEast Asia & Pacific (excluding high income)East Asia & Pacific (IDA & IBRD countries)EcuadorEgypt, Arab Rep.El SalvadorEquatorial GuineaEritreaEstoniaEthiopiaEuro areaEurope & Central AsiaEurope & Central Asia (excluding high income)Europe & Central Asia (IDA & IBRD countries)European UnionFaroe IslandsFijiFinlandFragile and conflict affected situationsFranceFrench PolynesiaGabonGambia, TheGeorgiaGermanyGhanaGreeceGrenadaGuatemalaGuineaGuinea-BissauGuyanaHaitiHeavily indebted poor countries (HIPC)High incomeHondurasHong Kong SAR, ChinaHungaryIBRD onlyIcelandIDA & IBRD totalIDA blendIDA onlyIDA totalIndiaIndonesiaIran, Islamic Rep.IraqIrelandIsraelItalyJamaicaJapanJordanKazakhstanKenyaKiribatiKorea, Rep.KosovoKuwaitKyrgyz RepublicLao PDRLate-demographic dividendLatin America & Caribbean Latin America & Caribbean (excluding high income)Latin America & the Caribbean (IDA & IBRD countries)LatviaLeast developed countries: UN classificationLebanonLesothoLiberiaLibyaLithuaniaLow & middle incomeLow incomeLower middle incomeLuxembourgMacao SAR, ChinaMacedonia, FYRMadagascarMalawiMalaysiaMaldivesMaliMaltaMauritaniaMauritiusMexicoMicronesia, Fed. Sts.Middle East & North AfricaMiddle East & North Africa (excluding high income)Middle East & North Africa (IDA & IBRD countries)Middle incomeMoldovaMongoliaMontenegroMoroccoMozambiqueMyanmarNamibiaNepalNetherlandsNew CaledoniaNew ZealandNicaraguaNigerNigeriaNorth AmericaNorwayOECD membersOmanOther small statesPacific island small statesPakistanPalauPanamaPapua New GuineaParaguayPeruPhilippinesPolandPortugalPost-demographic dividendPre-demographic dividendPuerto RicoQatarRomaniaRussian FederationRwandaSamoaSaudi ArabiaSenegalSerbiaSeychellesSierra LeoneSingaporeSlovak RepublicSloveniaSmall statesSolomon IslandsSomaliaSouth AfricaSouth AsiaSouth Asia (IDA & IBRD)South SudanSpainSri LankaSt. Kitts and NevisSt. LuciaSt. Vincent and the GrenadinesSub-Saharan Africa Sub-Saharan Africa (excluding high income)Sub-Saharan Africa (IDA & IBRD countries)SudanSurinameSwazilandSwedenSwitzerlandSyrian Arab RepublicTajikistanTanzaniaThailandTimor-LesteTogoTongaTrinidad and TobagoTunisiaTurkeyTurkmenistanUgandaUkraineUnited Arab EmiratesUnited KingdomUnited StatesUpper middle incomeUruguayUzbekistanVanuatuVenezuela, RBVietnamWest Bank and GazaWorldYemen, Rep.ZambiaZimbabwe Timeline:
This timeline shows a graph from 1961 to 2016 of Niger. No data until 1960. Number of actual observations by date: 56.
Source name:
World Development Indicators
Source organization:
World Bank national accounts data, and OECD National Accounts data files.
Categories, topics:
Economy & Growth, Trade
Last updated:
apr 23, 2017
Indicators value changes by year
Minimum:
14.506
jan 1, 1961
At the date of observation
Value
Absolute change
Change from previous value
jan 1, 1961
14.506
+14.506
0.0%
jan 1, 1962
17.827
+3.321
22.89%
jan 1, 1963
22.231
+4.405
24.71%
jan 1, 1964
19.633
-2.598
-11.69%
jan 1, 1965
23.365
+3.732
19.01%
jan 1, 1966
23.5
+0.135
0.58%
jan 1, 1967
28.538
+5.038
21.44%
jan 1, 1968
22.804
-5.734
-20.09%
jan 1, 1969
22.29
-0.514
-2.25%
jan 1, 1970
25.831
+3.54
15.88%
jan 1, 1971
28.873
+3.042
11.78%
jan 1, 1972
27.969
-0.904
-3.13%
jan 1, 1973
34.708
+6.739
24.1%
jan 1, 1974
39.25
+4.541
13.08%
jan 1, 1975
41.244
+1.994
5.08%
jan 1, 1976
50.24
+8.997
21.81%
jan 1, 1977
56.601
+6.361
12.66%
jan 1, 1978
48.972
-7.629
-13.48%
jan 1, 1979
50.359
+1.387
2.83%
jan 1, 1980
65.412
+15.053
29.89%
jan 1, 1981
62.71
-2.702
-4.13%
jan 1, 1982
60.357
-2.353
-3.75%
jan 1, 1983
57.068
-3.289
-5.45%
jan 1, 1984
47.739
-9.329
-16.35%
jan 1, 1985
49.876
+2.136
4.48%
jan 1, 1986
53.527
+3.651
7.32%
jan 1, 1987
40.692
-12.834
-23.98%
jan 1, 1988
45.985
+5.292
13.01%
jan 1, 1989
41.888
-4.096
-8.91%
jan 1, 1990
39.898
-1.99
-4.75%
jan 1, 1991
36.413
-3.485
-8.73%
jan 1, 1992
32.781
-3.632
-9.97%
jan 1, 1993
34.592
+1.81
5.52%
jan 1, 1994
33.739
-0.852
-2.46%
jan 1, 1995
43.412
+9.672
28.67%
jan 1, 1996
42.477
-0.935
-2.15%
jan 1, 1997
44.399
+1.923
4.53%
jan 1, 1998
41.465
-2.934
-6.61%
jan 1, 1999
44.101
+2.636
6.36%
jan 1, 2000
39.133
-4.969
-11.27%
jan 1, 2001
43.492
+4.359
11.14%
jan 1, 2002
41.534
-1.957
-4.5%
jan 1, 2003
42.394
+0.859
2.07%
jan 1, 2004
39.984
-2.41
-5.68%
jan 1, 2005
45.27
+5.286
13.22%
jan 1, 2006
47.395
+2.125
4.69%
jan 1, 2007
45.921
-1.474
-3.11%
jan 1, 2008
47.354
+1.433
3.12%
jan 1, 2009
53.418
+6.063
12.8%
jan 1, 2010
67.178
+13.76
25.76%
jan 1, 2011
71.29
+4.112
6.12%
jan 1, 2012
68.689
-2.601
-3.65%
jan 1, 2013
61.221
-7.469
-10.87%
jan 1, 2014
61.716
+0.496
0.81%
jan 1, 2015
60.182
-1.534
-2.49%
jan 1, 2016
56.616
-3.566
-5.92%
Ranking of countries by current statistics by years


Comments: