29
/
en
AIzaSyAYiBZKx7MnpbEhh9jyipgxe19OcubqV5w
April 1, 2024
263094
Thailand
THA
true
2
1
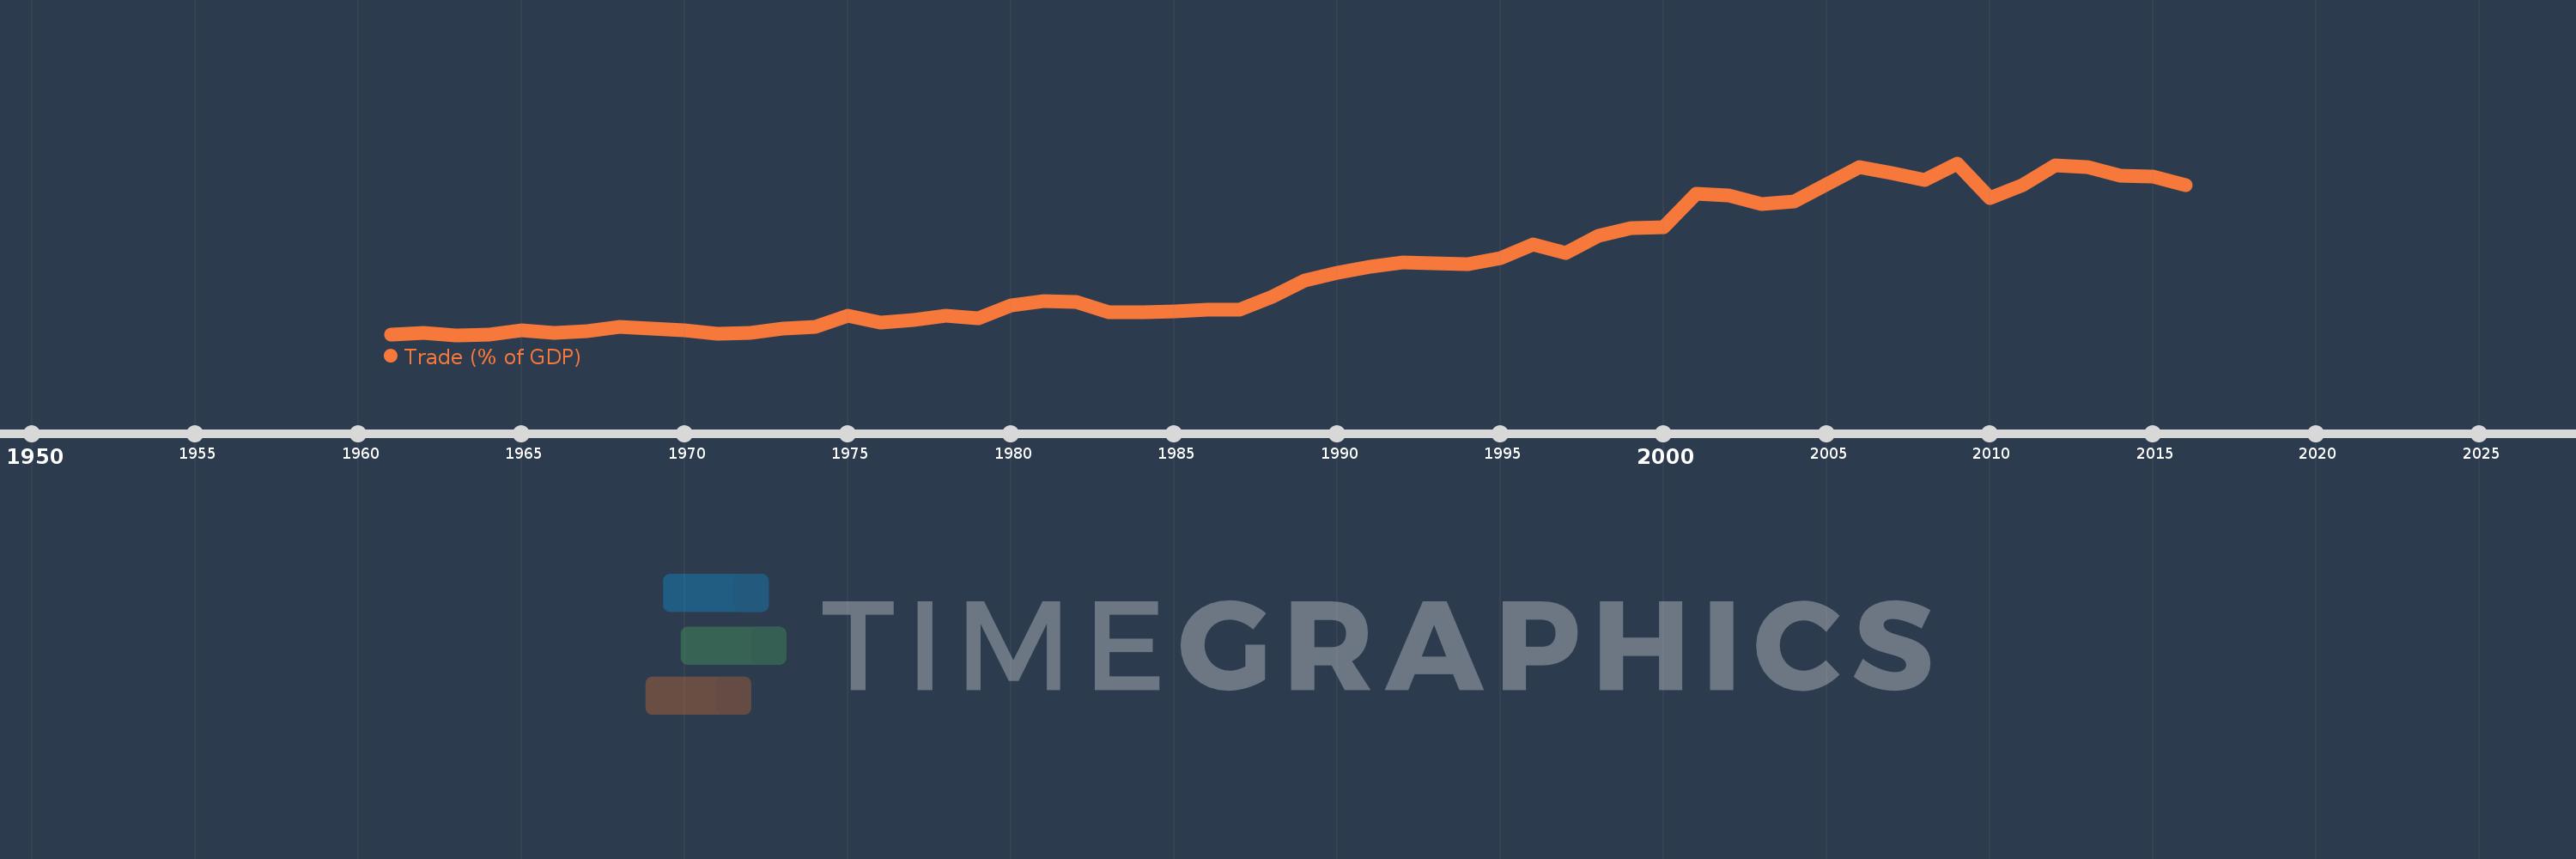
Trade (% of GDP)
2016,2015,2014,2013,2012,2011,2010,2009,2008,2007,2006,2005,2004,2003,2002,2001,2000,1999,1998,1997,1996,1995,1994,1993,1992,1991,1990,1989,1988,1987,1986,1985,1984,1983,1982,1981,1980,1979,1978,1977,1976,1975,1974,1973,1972,1971,1970,1969,1968,1967,1966,1965,1964,1963,1962,1961
This statistics in other country:
AfghanistanAlbaniaAlgeriaAngolaAntigua and BarbudaArab WorldArgentinaArmeniaArubaAustraliaAustriaAzerbaijanBahamas, TheBahrainBangladeshBarbadosBelarusBelgiumBelizeBeninBermudaBhutanBoliviaBosnia and HerzegovinaBotswanaBrazilBrunei DarussalamBulgariaBurkina FasoBurundiCabo VerdeCambodiaCameroonCanadaCaribbean small statesCentral African RepublicCentral Europe and the BalticsChadChileChinaColombiaComorosCongo, Dem. Rep.Congo, Rep.Costa RicaCote d'IvoireCroatiaCubaCyprusCzech RepublicDenmarkDjiboutiDominicaDominican RepublicEarly-demographic dividendEast Asia & PacificEast Asia & Pacific (excluding high income)East Asia & Pacific (IDA & IBRD countries)EcuadorEgypt, Arab Rep.El SalvadorEquatorial GuineaEritreaEstoniaEthiopiaEuro areaEurope & Central AsiaEurope & Central Asia (excluding high income)Europe & Central Asia (IDA & IBRD countries)European UnionFaroe IslandsFijiFinlandFragile and conflict affected situationsFranceFrench PolynesiaGabonGambia, TheGeorgiaGermanyGhanaGreeceGrenadaGuatemalaGuineaGuinea-BissauGuyanaHaitiHeavily indebted poor countries (HIPC)High incomeHondurasHong Kong SAR, ChinaHungaryIBRD onlyIcelandIDA & IBRD totalIDA blendIDA onlyIDA totalIndiaIndonesiaIran, Islamic Rep.IraqIrelandIsraelItalyJamaicaJapanJordanKazakhstanKenyaKiribatiKorea, Rep.KosovoKuwaitKyrgyz RepublicLao PDRLate-demographic dividendLatin America & Caribbean Latin America & Caribbean (excluding high income)Latin America & the Caribbean (IDA & IBRD countries)LatviaLeast developed countries: UN classificationLebanonLesothoLiberiaLibyaLithuaniaLow & middle incomeLow incomeLower middle incomeLuxembourgMacao SAR, ChinaMacedonia, FYRMadagascarMalawiMalaysiaMaldivesMaliMaltaMauritaniaMauritiusMexicoMicronesia, Fed. Sts.Middle East & North AfricaMiddle East & North Africa (excluding high income)Middle East & North Africa (IDA & IBRD countries)Middle incomeMoldovaMongoliaMontenegroMoroccoMozambiqueMyanmarNamibiaNepalNetherlandsNew CaledoniaNew ZealandNicaraguaNigerNigeriaNorth AmericaNorwayOECD membersOmanOther small statesPacific island small statesPakistanPalauPanamaPapua New GuineaParaguayPeruPhilippinesPolandPortugalPost-demographic dividendPre-demographic dividendPuerto RicoQatarRomaniaRussian FederationRwandaSamoaSaudi ArabiaSenegalSerbiaSeychellesSierra LeoneSingaporeSlovak RepublicSloveniaSmall statesSolomon IslandsSomaliaSouth AfricaSouth AsiaSouth Asia (IDA & IBRD)South SudanSpainSri LankaSt. Kitts and NevisSt. LuciaSt. Vincent and the GrenadinesSub-Saharan Africa Sub-Saharan Africa (excluding high income)Sub-Saharan Africa (IDA & IBRD countries)SudanSurinameSwazilandSwedenSwitzerlandSyrian Arab RepublicTajikistanTanzaniaThailandTimor-LesteTogoTongaTrinidad and TobagoTunisiaTurkeyTurkmenistanUgandaUkraineUnited Arab EmiratesUnited KingdomUnited StatesUpper middle incomeUruguayUzbekistanVanuatuVenezuela, RBVietnamWest Bank and GazaWorldYemen, Rep.ZambiaZimbabwe Timeline:
This timeline shows a graph from 1961 to 2016 of Thailand. No data until 1960. Number of actual observations by date: 56.
Source name:
World Development Indicators
Source organization:
World Bank national accounts data, and OECD National Accounts data files.
Categories, topics:
Economy & Growth, Trade
Last updated:
apr 23, 2017
Indicators value changes by year
Minimum:
33.336
jan 1, 1963
Maximum:
140.437
jan 1, 2009
At the date of observation
Value
Absolute change
Change from previous value
jan 1, 1961
33.56
+33.56
0.0%
jan 1, 1962
34.446
+0.886
2.64%
jan 1, 1963
33.336
-1.109
-3.22%
jan 1, 1964
33.509
+0.173
0.52%
jan 1, 1965
36.13
+2.621
7.82%
jan 1, 1966
34.916
-1.214
-3.36%
jan 1, 1967
35.56
+0.644
1.84%
jan 1, 1968
38.373
+2.813
7.91%
jan 1, 1969
37.62
-0.753
-1.96%
jan 1, 1970
36.122
-1.498
-3.98%
jan 1, 1971
34.402
-1.72
-4.76%
jan 1, 1972
34.802
+0.4
1.16%
jan 1, 1973
37.373
+2.571
7.39%
jan 1, 1974
38.649
+1.276
3.41%
jan 1, 1975
45.545
+6.896
17.84%
jan 1, 1976
41.338
-4.207
-9.24%
jan 1, 1977
42.94
+1.602
3.88%
jan 1, 1978
45.336
+2.396
5.58%
jan 1, 1979
43.999
-1.337
-2.95%
jan 1, 1980
51.868
+7.869
17.88%
jan 1, 1981
54.479
+2.611
5.03%
jan 1, 1982
53.969
-0.51
-0.94%
jan 1, 1983
47.548
-6.42
-11.9%
jan 1, 1984
47.384
-0.164
-0.34%
jan 1, 1985
48.069
+0.685
1.45%
jan 1, 1986
49.155
+1.086
2.26%
jan 1, 1987
49.171
+0.016
0.03%
jan 1, 1988
57.228
+8.057
16.39%
jan 1, 1989
67.413
+10.185
17.8%
jan 1, 1990
72.407
+4.993
7.41%
jan 1, 1991
75.782
+3.375
4.66%
jan 1, 1992
78.471
+2.689
3.55%
jan 1, 1993
77.955
-0.516
-0.66%
jan 1, 1994
77.746
-0.209
-0.27%
jan 1, 1995
81.249
+3.503
4.51%
jan 1, 1996
89.756
+8.507
10.47%
jan 1, 1997
84.274
-5.482
-6.11%
jan 1, 1998
95.052
+10.778
12.79%
jan 1, 1999
100.24
+5.188
5.46%
jan 1, 2000
100.706
+0.466
0.46%
jan 1, 2001
121.298
+20.591
20.45%
jan 1, 2002
120.268
-1.03
-0.85%
jan 1, 2003
114.97
-5.298
-4.41%
jan 1, 2004
116.693
+1.723
1.5%
jan 1, 2005
127.412
+10.719
9.19%
jan 1, 2006
137.854
+10.442
8.2%
jan 1, 2007
134.087
-3.767
-2.73%
jan 1, 2008
129.873
-4.214
-3.14%
jan 1, 2009
140.437
+10.564
8.13%
jan 1, 2010
118.877
-21.56
-15.35%
jan 1, 2011
126.757
+7.88
6.63%
jan 1, 2012
138.864
+12.107
9.55%
jan 1, 2013
137.765
-1.099
-0.79%
jan 1, 2014
132.753
-5.012
-3.64%
jan 1, 2015
131.957
-0.797
-0.6%
jan 1, 2016
126.801
-5.155
-3.91%
Ranking of countries by current statistics by years


Comments: