29
/
en
AIzaSyAYiBZKx7MnpbEhh9jyipgxe19OcubqV5w
April 1, 2024
41140
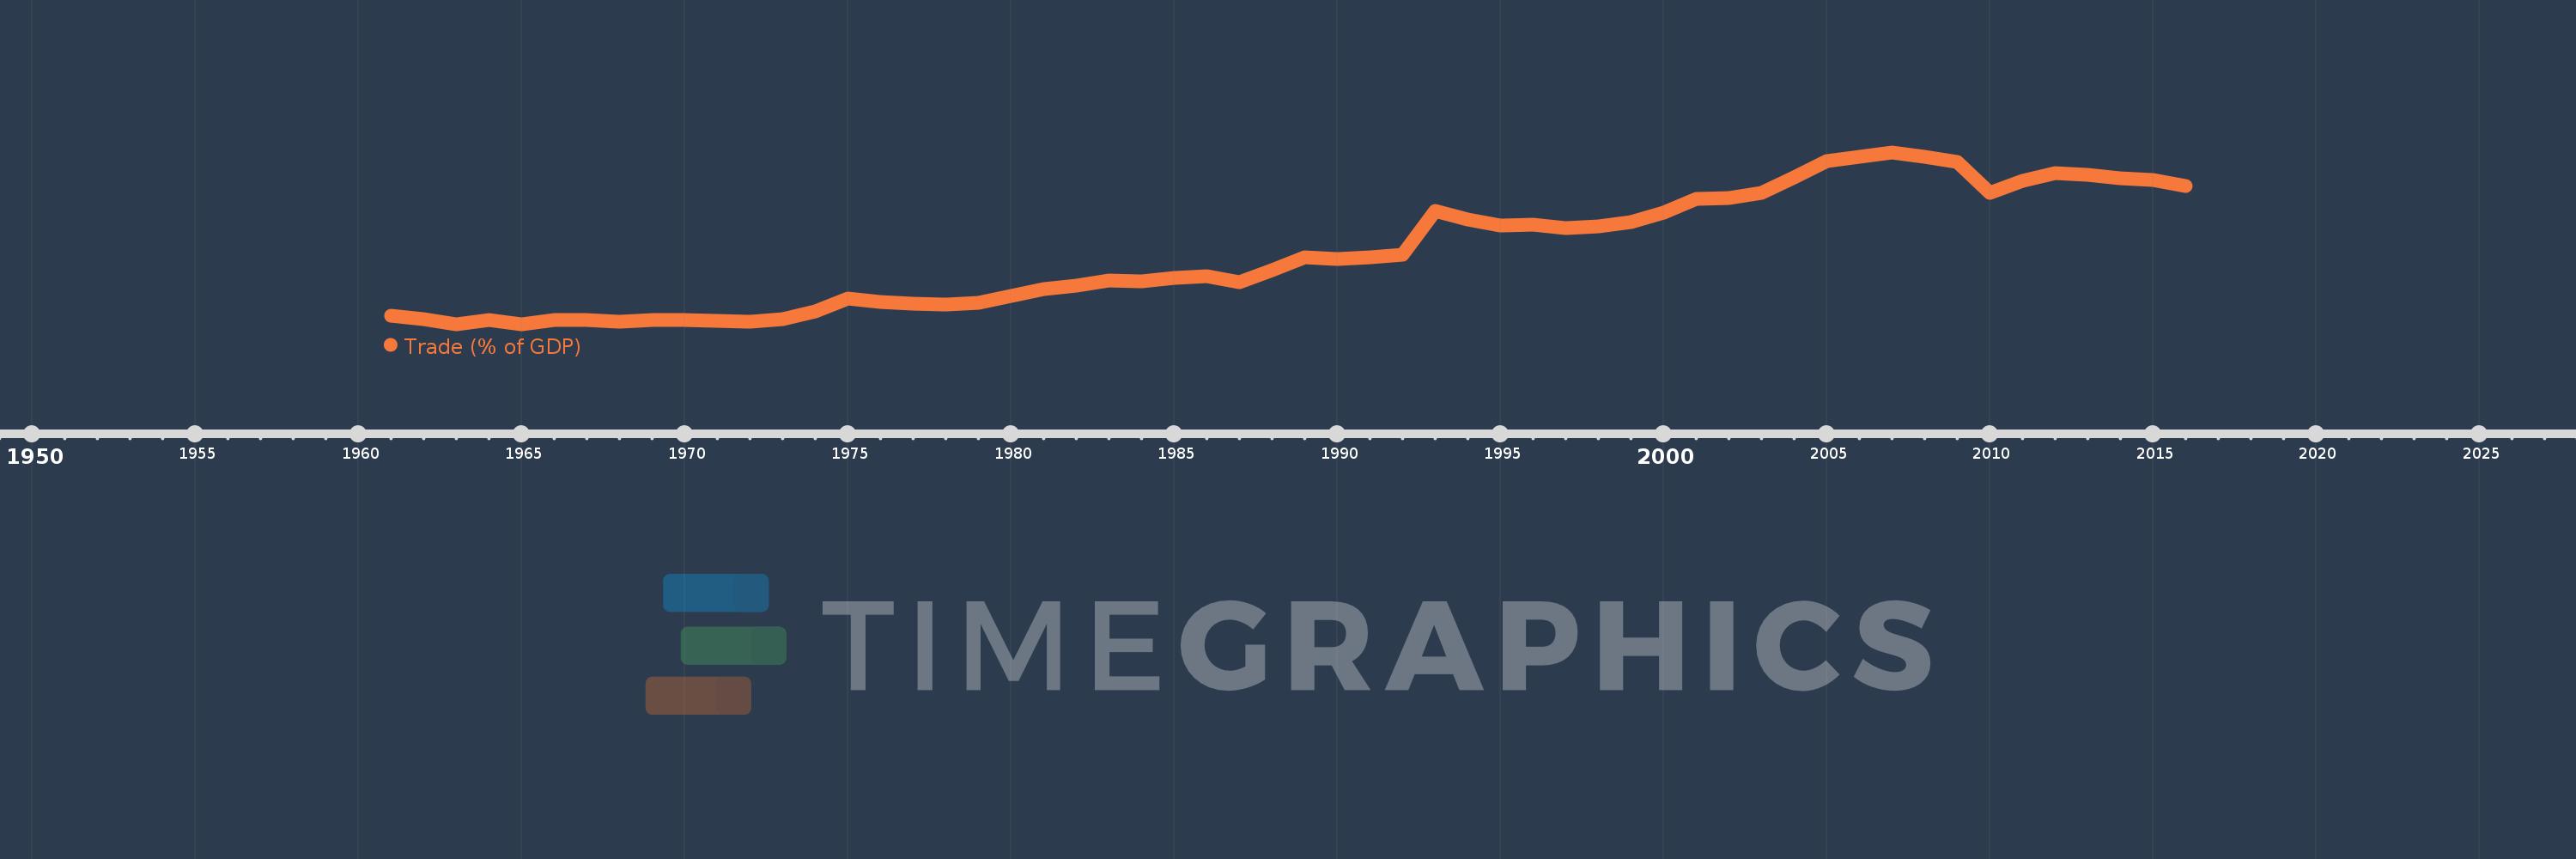
Late-demographic dividend
LTE
false
2
1
Trade (% of GDP)
2016,2015,2014,2013,2012,2011,2010,2009,2008,2007,2006,2005,2004,2003,2002,2001,2000,1999,1998,1997,1996,1995,1994,1993,1992,1991,1990,1989,1988,1987,1986,1985,1984,1983,1982,1981,1980,1979,1978,1977,1976,1975,1974,1973,1972,1971,1970,1969,1968,1967,1966,1965,1964,1963,1962,1961
This statistics in other country:
AfghanistanAlbaniaAlgeriaAngolaAntigua and BarbudaArab WorldArgentinaArmeniaArubaAustraliaAustriaAzerbaijanBahamas, TheBahrainBangladeshBarbadosBelarusBelgiumBelizeBeninBermudaBhutanBoliviaBosnia and HerzegovinaBotswanaBrazilBrunei DarussalamBulgariaBurkina FasoBurundiCabo VerdeCambodiaCameroonCanadaCaribbean small statesCentral African RepublicCentral Europe and the BalticsChadChileChinaColombiaComorosCongo, Dem. Rep.Congo, Rep.Costa RicaCote d'IvoireCroatiaCubaCyprusCzech RepublicDenmarkDjiboutiDominicaDominican RepublicEarly-demographic dividendEast Asia & PacificEast Asia & Pacific (excluding high income)East Asia & Pacific (IDA & IBRD countries)EcuadorEgypt, Arab Rep.El SalvadorEquatorial GuineaEritreaEstoniaEthiopiaEuro areaEurope & Central AsiaEurope & Central Asia (excluding high income)Europe & Central Asia (IDA & IBRD countries)European UnionFaroe IslandsFijiFinlandFragile and conflict affected situationsFranceFrench PolynesiaGabonGambia, TheGeorgiaGermanyGhanaGreeceGrenadaGuatemalaGuineaGuinea-BissauGuyanaHaitiHeavily indebted poor countries (HIPC)High incomeHondurasHong Kong SAR, ChinaHungaryIBRD onlyIcelandIDA & IBRD totalIDA blendIDA onlyIDA totalIndiaIndonesiaIran, Islamic Rep.IraqIrelandIsraelItalyJamaicaJapanJordanKazakhstanKenyaKiribatiKorea, Rep.KosovoKuwaitKyrgyz RepublicLao PDRLate-demographic dividendLatin America & Caribbean Latin America & Caribbean (excluding high income)Latin America & the Caribbean (IDA & IBRD countries)LatviaLeast developed countries: UN classificationLebanonLesothoLiberiaLibyaLithuaniaLow & middle incomeLow incomeLower middle incomeLuxembourgMacao SAR, ChinaMacedonia, FYRMadagascarMalawiMalaysiaMaldivesMaliMaltaMauritaniaMauritiusMexicoMicronesia, Fed. Sts.Middle East & North AfricaMiddle East & North Africa (excluding high income)Middle East & North Africa (IDA & IBRD countries)Middle incomeMoldovaMongoliaMontenegroMoroccoMozambiqueMyanmarNamibiaNepalNetherlandsNew CaledoniaNew ZealandNicaraguaNigerNigeriaNorth AmericaNorwayOECD membersOmanOther small statesPacific island small statesPakistanPalauPanamaPapua New GuineaParaguayPeruPhilippinesPolandPortugalPost-demographic dividendPre-demographic dividendPuerto RicoQatarRomaniaRussian FederationRwandaSamoaSaudi ArabiaSenegalSerbiaSeychellesSierra LeoneSingaporeSlovak RepublicSloveniaSmall statesSolomon IslandsSomaliaSouth AfricaSouth AsiaSouth Asia (IDA & IBRD)South SudanSpainSri LankaSt. Kitts and NevisSt. LuciaSt. Vincent and the GrenadinesSub-Saharan Africa Sub-Saharan Africa (excluding high income)Sub-Saharan Africa (IDA & IBRD countries)SudanSurinameSwazilandSwedenSwitzerlandSyrian Arab RepublicTajikistanTanzaniaThailandTimor-LesteTogoTongaTrinidad and TobagoTunisiaTurkeyTurkmenistanUgandaUkraineUnited Arab EmiratesUnited KingdomUnited StatesUpper middle incomeUruguayUzbekistanVanuatuVenezuela, RBVietnamWest Bank and GazaWorldYemen, Rep.ZambiaZimbabwe Timeline:
This timeline shows a graph from 1961 to 2016 of Late-demographic dividend. No data until 1960. Number of actual observations by date: 56.
Source name:
World Development Indicators
Source organization:
World Bank national accounts data, and OECD National Accounts data files.
Categories, topics:
Economy & Growth, Trade
Last updated:
apr 23, 2017
Indicators value changes by year
Minimum:
15.086
jan 1, 1963
Maximum:
69.227
jan 1, 2007
At the date of observation
Value
Absolute change
Change from previous value
jan 1, 1961
17.79
+17.79
0.0%
jan 1, 1962
16.809
-0.981
-5.51%
jan 1, 1963
15.086
-1.723
-10.25%
jan 1, 1964
16.478
+1.393
9.23%
jan 1, 1965
15.092
-1.386
-8.41%
jan 1, 1966
16.51
+1.418
9.39%
jan 1, 1967
16.412
-0.098
-0.59%
jan 1, 1968
15.886
-0.526
-3.2%
jan 1, 1969
16.524
+0.638
4.01%
jan 1, 1970
16.302
-0.222
-1.34%
jan 1, 1971
16.264
-0.038
-0.23%
jan 1, 1972
15.9
-0.364
-2.24%
jan 1, 1973
16.62
+0.72
4.53%
jan 1, 1974
19.031
+2.411
14.51%
jan 1, 1975
23.191
+4.16
21.86%
jan 1, 1976
22.185
-1.006
-4.34%
jan 1, 1977
21.491
-0.694
-3.13%
jan 1, 1978
21.393
-0.098
-0.46%
jan 1, 1979
21.936
+0.543
2.54%
jan 1, 1980
23.926
+1.989
9.07%
jan 1, 1981
26.096
+2.17
9.07%
jan 1, 1982
27.181
+1.085
4.16%
jan 1, 1983
28.819
+1.638
6.02%
jan 1, 1984
28.534
-0.285
-0.99%
jan 1, 1985
29.611
+1.078
3.78%
jan 1, 1986
30.276
+0.664
2.24%
jan 1, 1987
28.418
-1.858
-6.14%
jan 1, 1988
32.156
+3.738
13.15%
jan 1, 1989
36.243
+4.087
12.71%
jan 1, 1990
35.692
-0.55
-1.52%
jan 1, 1991
36.293
+0.601
1.68%
jan 1, 1992
36.95
+0.657
1.81%
jan 1, 1993
50.659
+13.709
37.1%
jan 1, 1994
47.96
-2.699
-5.33%
jan 1, 1995
46.207
-1.753
-3.65%
jan 1, 1996
46.592
+0.385
0.83%
jan 1, 1997
45.404
-1.188
-2.55%
jan 1, 1998
45.824
+0.42
0.92%
jan 1, 1999
47.268
+1.444
3.15%
jan 1, 2000
50.221
+2.953
6.25%
jan 1, 2001
54.701
+4.48
8.92%
jan 1, 2002
54.88
+0.179
0.33%
jan 1, 2003
56.398
+1.518
2.77%
jan 1, 2004
61.424
+5.026
8.91%
jan 1, 2005
66.553
+5.129
8.35%
jan 1, 2006
67.859
+1.306
1.96%
jan 1, 2007
69.227
+1.368
2.02%
jan 1, 2008
67.852
-1.375
-1.99%
jan 1, 2009
66.153
-1.698
-2.5%
jan 1, 2010
56.582
-9.572
-14.47%
jan 1, 2011
60.273
+3.691
6.52%
jan 1, 2012
62.7
+2.428
4.03%
jan 1, 2013
62.201
-0.499
-0.8%
jan 1, 2014
61.212
-0.989
-1.59%
jan 1, 2015
60.622
-0.59
-0.96%
jan 1, 2016
58.728
-1.894
-3.12%
Ranking of countries by current statistics by years


Comments: