29
/
en
AIzaSyAYiBZKx7MnpbEhh9jyipgxe19OcubqV5w
April 1, 2024
127912
Equatorial Guinea
GNQ
true
2
1
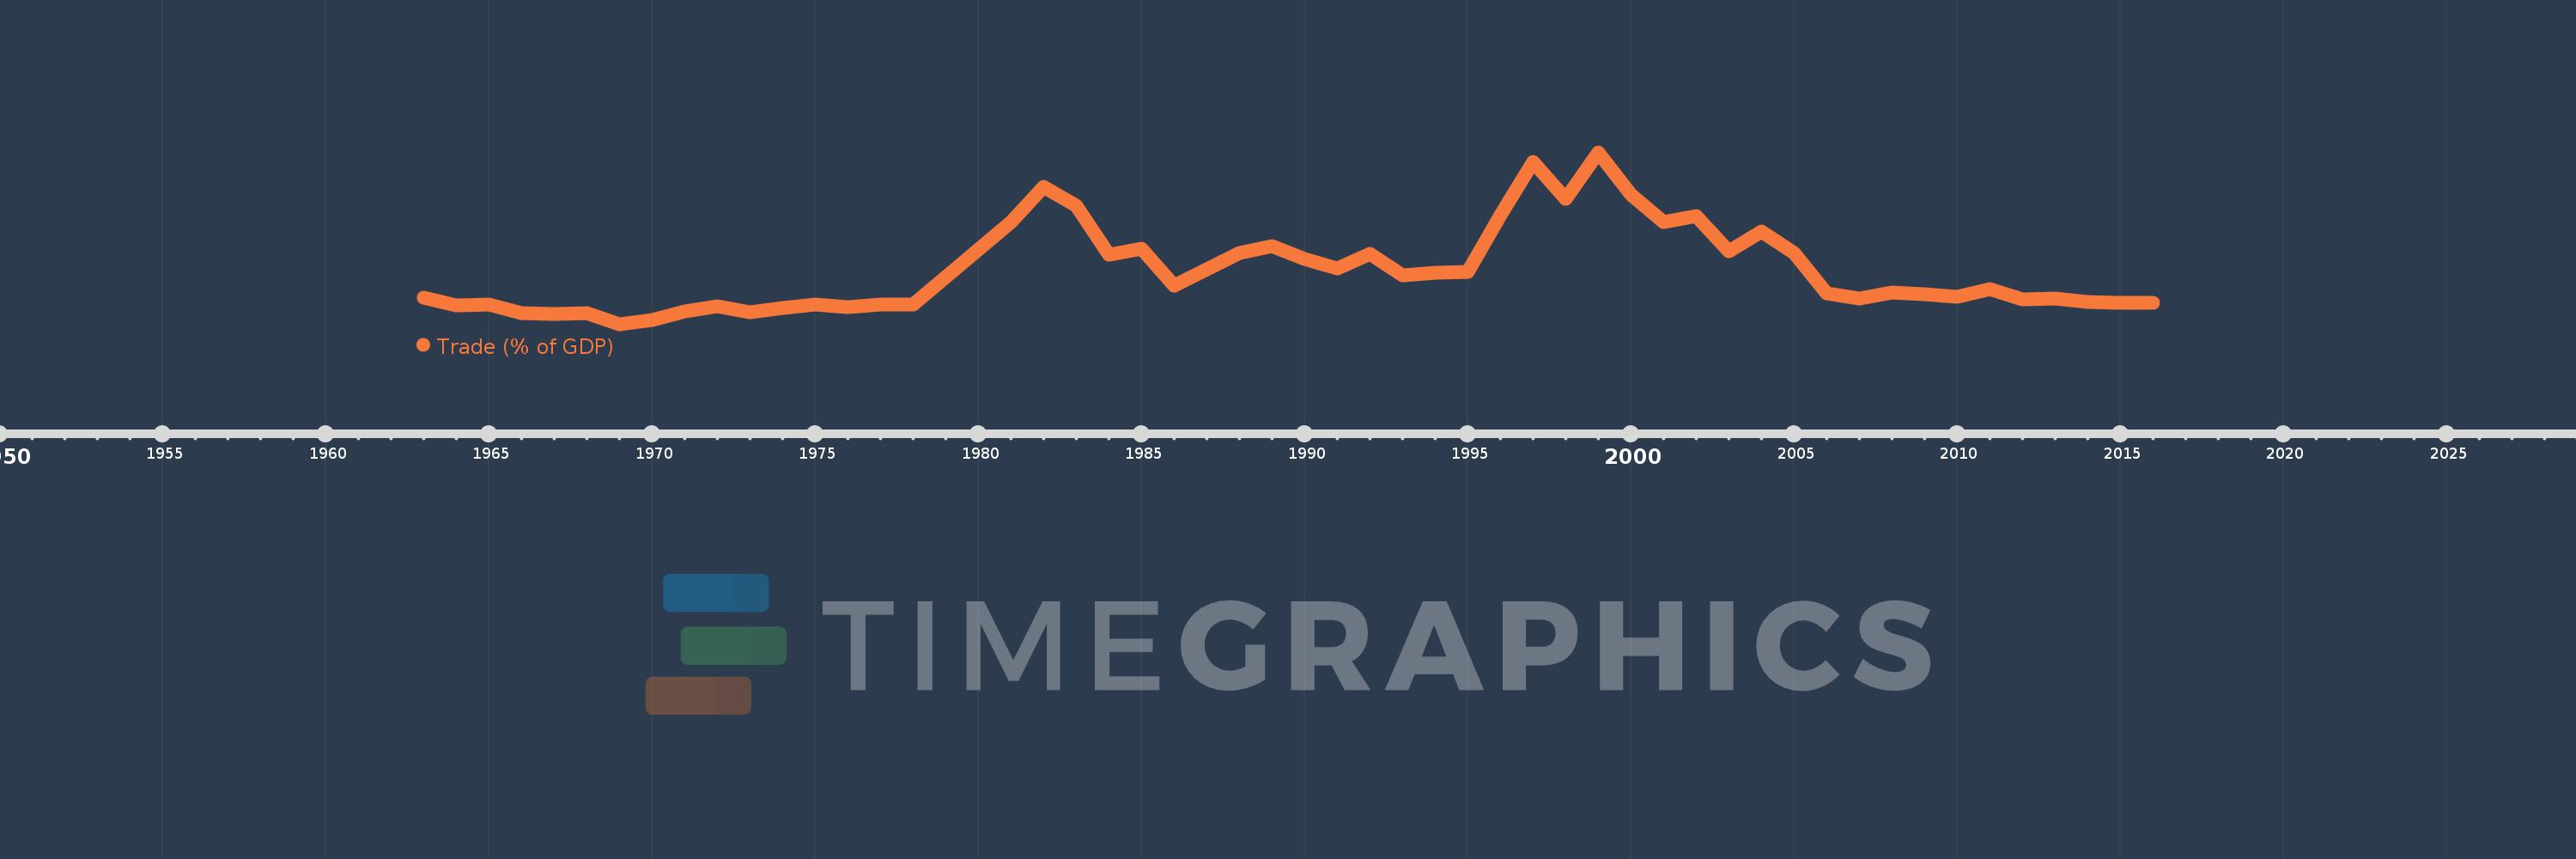
Trade (% of GDP)
2016,2015,2014,2013,2012,2011,2010,2009,2008,2007,2006,2005,2004,2003,2002,2001,2000,1999,1998,1997,1996,1995,1994,1993,1992,1991,1990,1989,1988,1987,1986,1985,1984,1983,1982,1981,1978,1977,1976,1975,1974,1973,1972,1971,1970,1969,1968,1967,1966,1965,1964,1963
This statistics in other country:
AfghanistanAlbaniaAlgeriaAngolaAntigua and BarbudaArab WorldArgentinaArmeniaArubaAustraliaAustriaAzerbaijanBahamas, TheBahrainBangladeshBarbadosBelarusBelgiumBelizeBeninBermudaBhutanBoliviaBosnia and HerzegovinaBotswanaBrazilBrunei DarussalamBulgariaBurkina FasoBurundiCabo VerdeCambodiaCameroonCanadaCaribbean small statesCentral African RepublicCentral Europe and the BalticsChadChileChinaColombiaComorosCongo, Dem. Rep.Congo, Rep.Costa RicaCote d'IvoireCroatiaCubaCyprusCzech RepublicDenmarkDjiboutiDominicaDominican RepublicEarly-demographic dividendEast Asia & PacificEast Asia & Pacific (excluding high income)East Asia & Pacific (IDA & IBRD countries)EcuadorEgypt, Arab Rep.El SalvadorEquatorial GuineaEritreaEstoniaEthiopiaEuro areaEurope & Central AsiaEurope & Central Asia (excluding high income)Europe & Central Asia (IDA & IBRD countries)European UnionFaroe IslandsFijiFinlandFragile and conflict affected situationsFranceFrench PolynesiaGabonGambia, TheGeorgiaGermanyGhanaGreeceGrenadaGuatemalaGuineaGuinea-BissauGuyanaHaitiHeavily indebted poor countries (HIPC)High incomeHondurasHong Kong SAR, ChinaHungaryIBRD onlyIcelandIDA & IBRD totalIDA blendIDA onlyIDA totalIndiaIndonesiaIran, Islamic Rep.IraqIrelandIsraelItalyJamaicaJapanJordanKazakhstanKenyaKiribatiKorea, Rep.KosovoKuwaitKyrgyz RepublicLao PDRLate-demographic dividendLatin America & Caribbean Latin America & Caribbean (excluding high income)Latin America & the Caribbean (IDA & IBRD countries)LatviaLeast developed countries: UN classificationLebanonLesothoLiberiaLibyaLithuaniaLow & middle incomeLow incomeLower middle incomeLuxembourgMacao SAR, ChinaMacedonia, FYRMadagascarMalawiMalaysiaMaldivesMaliMaltaMauritaniaMauritiusMexicoMicronesia, Fed. Sts.Middle East & North AfricaMiddle East & North Africa (excluding high income)Middle East & North Africa (IDA & IBRD countries)Middle incomeMoldovaMongoliaMontenegroMoroccoMozambiqueMyanmarNamibiaNepalNetherlandsNew CaledoniaNew ZealandNicaraguaNigerNigeriaNorth AmericaNorwayOECD membersOmanOther small statesPacific island small statesPakistanPalauPanamaPapua New GuineaParaguayPeruPhilippinesPolandPortugalPost-demographic dividendPre-demographic dividendPuerto RicoQatarRomaniaRussian FederationRwandaSamoaSaudi ArabiaSenegalSerbiaSeychellesSierra LeoneSingaporeSlovak RepublicSloveniaSmall statesSolomon IslandsSomaliaSouth AfricaSouth AsiaSouth Asia (IDA & IBRD)South SudanSpainSri LankaSt. Kitts and NevisSt. LuciaSt. Vincent and the GrenadinesSub-Saharan Africa Sub-Saharan Africa (excluding high income)Sub-Saharan Africa (IDA & IBRD countries)SudanSurinameSwazilandSwedenSwitzerlandSyrian Arab RepublicTajikistanTanzaniaThailandTimor-LesteTogoTongaTrinidad and TobagoTunisiaTurkeyTurkmenistanUgandaUkraineUnited Arab EmiratesUnited KingdomUnited StatesUpper middle incomeUruguayUzbekistanVanuatuVenezuela, RBVietnamWest Bank and GazaWorldYemen, Rep.ZambiaZimbabwe Timeline:
This timeline shows a graph from 1963 to 2016 of Equatorial Guinea. No data until 1962. Number of actual observations by date: 52.
Source name:
World Development Indicators
Source organization:
World Bank national accounts data, and OECD National Accounts data files.
Categories, topics:
Economy & Growth, Trade
Last updated:
apr 23, 2017
Indicators value changes by year
Minimum:
44.816
jan 1, 1969
Maximum:
531.737
jan 1, 1999
At the date of observation
Value
Absolute change
Change from previous value
jan 1, 1963
119.497
+119.497
0.0%
jan 1, 1964
97.289
-22.208
-18.58%
jan 1, 1965
101.031
+3.741
3.85%
jan 1, 1966
75.163
-25.868
-25.6%
jan 1, 1967
74.664
-0.499
-0.66%
jan 1, 1968
75.141
+0.478
0.64%
jan 1, 1969
44.816
-30.325
-40.36%
jan 1, 1970
56.335
+11.519
25.7%
jan 1, 1971
80.791
+24.457
43.41%
jan 1, 1972
95.959
+15.168
18.77%
jan 1, 1973
79.169
-16.791
-17.5%
jan 1, 1974
91.889
+12.721
16.07%
jan 1, 1975
101.182
+9.292
10.11%
jan 1, 1976
93.794
-7.388
-7.3%
jan 1, 1977
99.488
+5.695
6.07%
jan 1, 1978
99.685
+0.197
0.2%
jan 1, 1981
333.589
+233.904
234.64%
jan 1, 1982
434.18
+100.591
30.15%
jan 1, 1983
381.258
-52.922
-12.19%
jan 1, 1984
240.656
-140.602
-36.88%
jan 1, 1985
259.516
+18.86
7.84%
jan 1, 1986
153.063
-106.453
-41.02%
jan 1, 1987
201.242
+48.18
31.48%
jan 1, 1988
246.707
+45.465
22.59%
jan 1, 1989
265.983
+19.276
7.81%
jan 1, 1990
228.404
-37.579
-14.13%
jan 1, 1991
203.344
-25.06
-10.97%
jan 1, 1992
243.275
+39.931
19.64%
jan 1, 1993
184.475
-58.8
-24.17%
jan 1, 1994
189.591
+5.117
2.77%
jan 1, 1995
191.871
+2.279
1.2%
jan 1, 1996
354.974
+163.103
85.01%
jan 1, 1997
504.884
+149.91
42.23%
jan 1, 1998
399.987
-104.896
-20.78%
jan 1, 1999
531.737
+131.75
32.94%
jan 1, 2000
412.12
-119.618
-22.5%
jan 1, 2001
334.133
-77.987
-18.92%
jan 1, 2002
351.106
+16.973
5.08%
jan 1, 2003
251.126
-99.98
-28.48%
jan 1, 2004
307.016
+55.89
22.26%
jan 1, 2005
245.996
-61.02
-19.88%
jan 1, 2006
131.024
-114.972
-46.74%
jan 1, 2007
118.533
-12.492
-9.53%
jan 1, 2008
134.084
+15.551
13.12%
jan 1, 2009
128.688
-5.396
-4.02%
jan 1, 2010
122.212
-6.476
-5.03%
jan 1, 2011
144.668
+22.456
18.37%
jan 1, 2012
114.377
-30.291
-20.94%
jan 1, 2013
116.675
+2.298
2.01%
jan 1, 2014
106.893
-9.782
-8.38%
jan 1, 2015
105.714
-1.179
-1.1%
jan 1, 2016
104.809
-0.905
-0.86%
Ranking of countries by current statistics by years


Comments: