29
/
en
AIzaSyAYiBZKx7MnpbEhh9jyipgxe19OcubqV5w
April 1, 2024
36263
High income
HIC
false
2
1
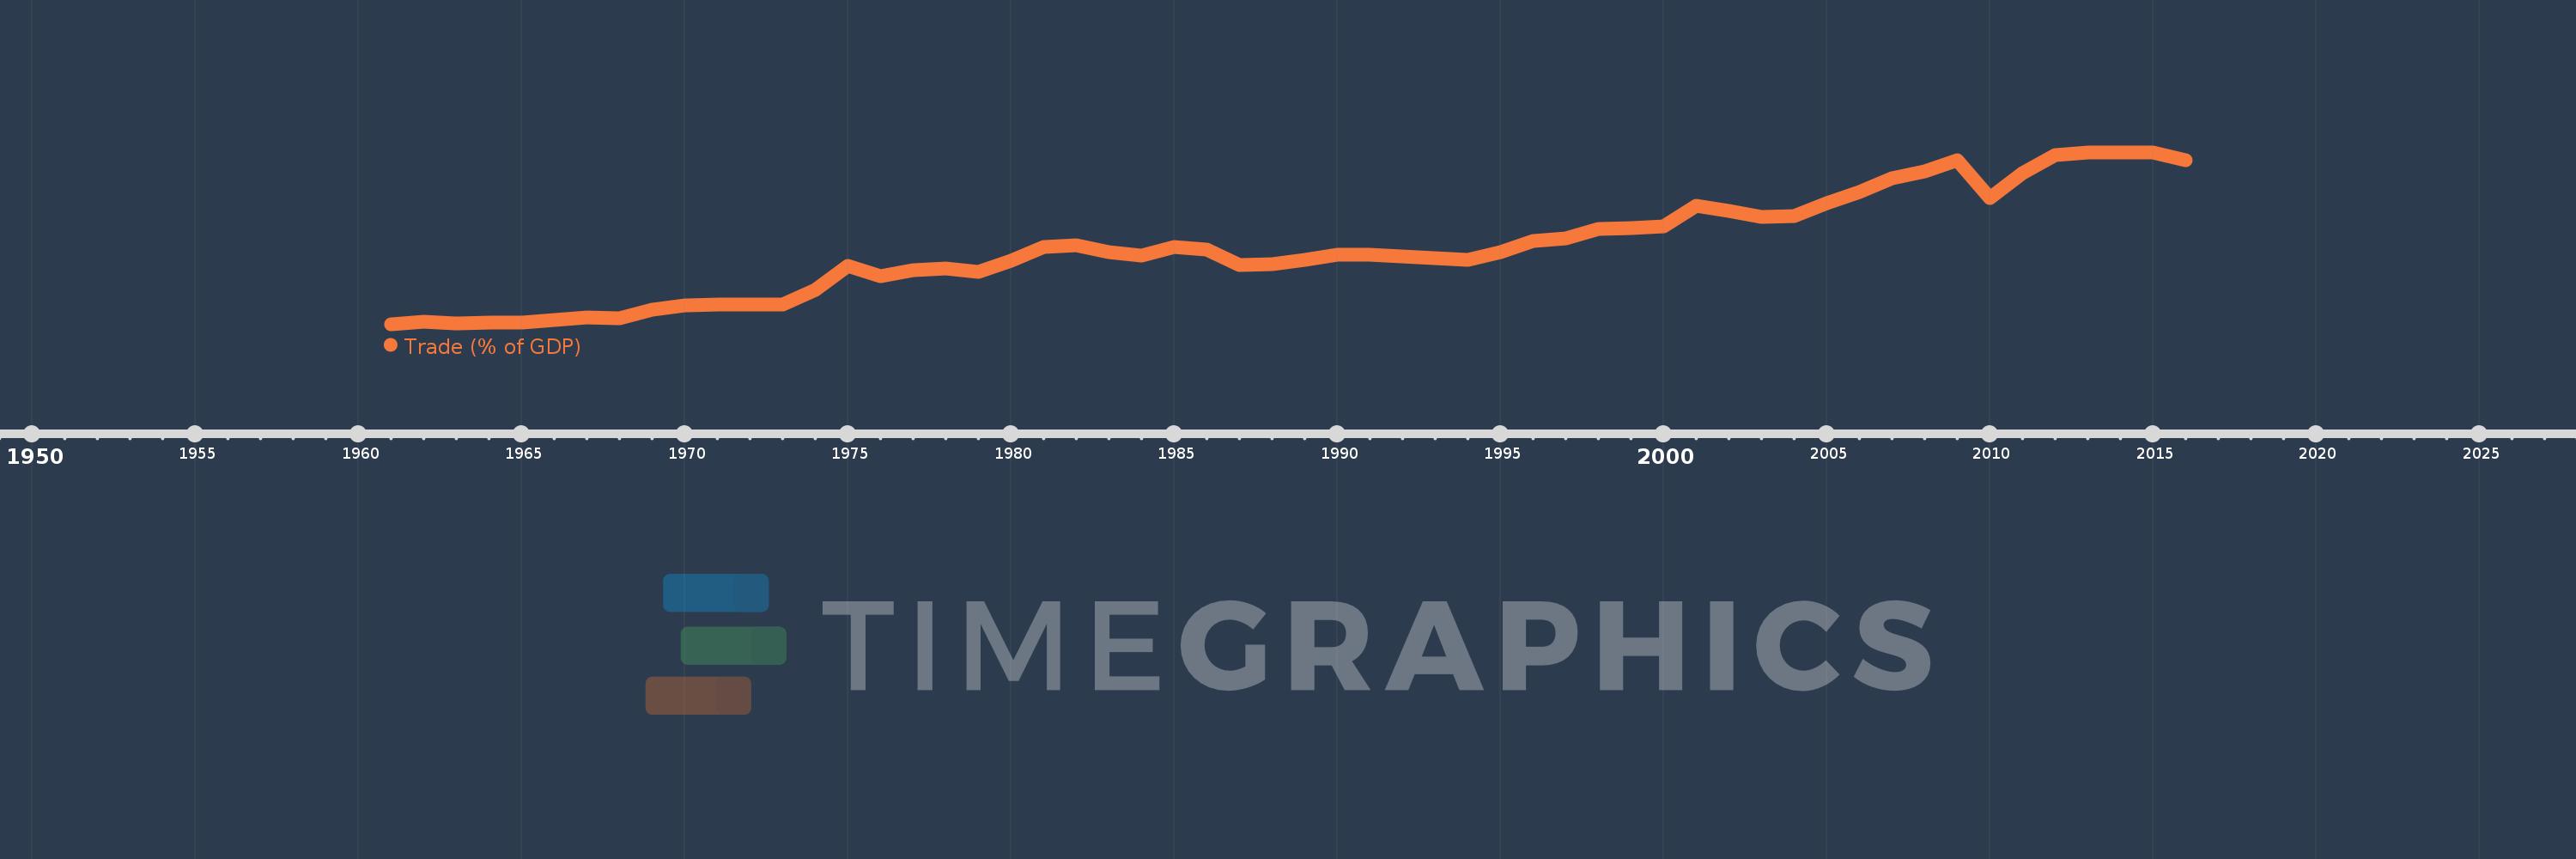
Trade (% of GDP)
2016,2015,2014,2013,2012,2011,2010,2009,2008,2007,2006,2005,2004,2003,2002,2001,2000,1999,1998,1997,1996,1995,1994,1993,1992,1991,1990,1989,1988,1987,1986,1985,1984,1983,1982,1981,1980,1979,1978,1977,1976,1975,1974,1973,1972,1971,1970,1969,1968,1967,1966,1965,1964,1963,1962,1961
This statistics in other country:
AfghanistanAlbaniaAlgeriaAngolaAntigua and BarbudaArab WorldArgentinaArmeniaArubaAustraliaAustriaAzerbaijanBahamas, TheBahrainBangladeshBarbadosBelarusBelgiumBelizeBeninBermudaBhutanBoliviaBosnia and HerzegovinaBotswanaBrazilBrunei DarussalamBulgariaBurkina FasoBurundiCabo VerdeCambodiaCameroonCanadaCaribbean small statesCentral African RepublicCentral Europe and the BalticsChadChileChinaColombiaComorosCongo, Dem. Rep.Congo, Rep.Costa RicaCote d'IvoireCroatiaCubaCyprusCzech RepublicDenmarkDjiboutiDominicaDominican RepublicEarly-demographic dividendEast Asia & PacificEast Asia & Pacific (excluding high income)East Asia & Pacific (IDA & IBRD countries)EcuadorEgypt, Arab Rep.El SalvadorEquatorial GuineaEritreaEstoniaEthiopiaEuro areaEurope & Central AsiaEurope & Central Asia (excluding high income)Europe & Central Asia (IDA & IBRD countries)European UnionFaroe IslandsFijiFinlandFragile and conflict affected situationsFranceFrench PolynesiaGabonGambia, TheGeorgiaGermanyGhanaGreeceGrenadaGuatemalaGuineaGuinea-BissauGuyanaHaitiHeavily indebted poor countries (HIPC)High incomeHondurasHong Kong SAR, ChinaHungaryIBRD onlyIcelandIDA & IBRD totalIDA blendIDA onlyIDA totalIndiaIndonesiaIran, Islamic Rep.IraqIrelandIsraelItalyJamaicaJapanJordanKazakhstanKenyaKiribatiKorea, Rep.KosovoKuwaitKyrgyz RepublicLao PDRLate-demographic dividendLatin America & Caribbean Latin America & Caribbean (excluding high income)Latin America & the Caribbean (IDA & IBRD countries)LatviaLeast developed countries: UN classificationLebanonLesothoLiberiaLibyaLithuaniaLow & middle incomeLow incomeLower middle incomeLuxembourgMacao SAR, ChinaMacedonia, FYRMadagascarMalawiMalaysiaMaldivesMaliMaltaMauritaniaMauritiusMexicoMicronesia, Fed. Sts.Middle East & North AfricaMiddle East & North Africa (excluding high income)Middle East & North Africa (IDA & IBRD countries)Middle incomeMoldovaMongoliaMontenegroMoroccoMozambiqueMyanmarNamibiaNepalNetherlandsNew CaledoniaNew ZealandNicaraguaNigerNigeriaNorth AmericaNorwayOECD membersOmanOther small statesPacific island small statesPakistanPalauPanamaPapua New GuineaParaguayPeruPhilippinesPolandPortugalPost-demographic dividendPre-demographic dividendPuerto RicoQatarRomaniaRussian FederationRwandaSamoaSaudi ArabiaSenegalSerbiaSeychellesSierra LeoneSingaporeSlovak RepublicSloveniaSmall statesSolomon IslandsSomaliaSouth AfricaSouth AsiaSouth Asia (IDA & IBRD)South SudanSpainSri LankaSt. Kitts and NevisSt. LuciaSt. Vincent and the GrenadinesSub-Saharan Africa Sub-Saharan Africa (excluding high income)Sub-Saharan Africa (IDA & IBRD countries)SudanSurinameSwazilandSwedenSwitzerlandSyrian Arab RepublicTajikistanTanzaniaThailandTimor-LesteTogoTongaTrinidad and TobagoTunisiaTurkeyTurkmenistanUgandaUkraineUnited Arab EmiratesUnited KingdomUnited StatesUpper middle incomeUruguayUzbekistanVanuatuVenezuela, RBVietnamWest Bank and GazaWorldYemen, Rep.ZambiaZimbabwe Timeline:
This timeline shows a graph from 1961 to 2016 of High income. No data until 1960. Number of actual observations by date: 56.
Source name:
World Development Indicators
Source organization:
World Bank national accounts data, and OECD National Accounts data files.
Categories, topics:
Economy & Growth, Trade
Last updated:
apr 23, 2017
Indicators value changes by year
Minimum:
25.994
jan 1, 1961
Maximum:
63.257
jan 1, 2013
At the date of observation
Value
Absolute change
Change from previous value
jan 1, 1961
25.994
+25.994
0.0%
jan 1, 1962
26.557
+0.563
2.17%
jan 1, 1963
26.13
-0.427
-1.61%
jan 1, 1964
26.275
+0.145
0.56%
jan 1, 1965
26.401
+0.126
0.48%
jan 1, 1966
26.943
+0.542
2.05%
jan 1, 1967
27.491
+0.549
2.04%
jan 1, 1968
27.337
-0.154
-0.56%
jan 1, 1969
29.209
+1.872
6.85%
jan 1, 1970
30.146
+0.936
3.21%
jan 1, 1971
30.198
+0.053
0.18%
jan 1, 1972
30.178
-0.021
-0.07%
jan 1, 1973
30.177
-0.001
0.0%
jan 1, 1974
33.335
+3.159
10.47%
jan 1, 1975
38.716
+5.381
16.14%
jan 1, 1976
36.397
-2.32
-5.99%
jan 1, 1977
37.799
+1.402
3.85%
jan 1, 1978
38.027
+0.228
0.6%
jan 1, 1979
37.393
-0.634
-1.67%
jan 1, 1980
39.746
+2.353
6.29%
jan 1, 1981
42.71
+2.964
7.46%
jan 1, 1982
43.097
+0.387
0.91%
jan 1, 1983
41.69
-1.407
-3.26%
jan 1, 1984
40.903
-0.787
-1.89%
jan 1, 1985
42.749
+1.846
4.51%
jan 1, 1986
42.1
-0.648
-1.52%
jan 1, 1987
38.811
-3.289
-7.81%
jan 1, 1988
39.096
+0.285
0.73%
jan 1, 1989
39.891
+0.795
2.03%
jan 1, 1990
41.007
+1.116
2.8%
jan 1, 1991
41.019
+0.011
0.03%
jan 1, 1992
40.683
-0.335
-0.82%
jan 1, 1993
40.291
-0.392
-0.96%
jan 1, 1994
39.977
-0.314
-0.78%
jan 1, 1995
41.566
+1.589
3.98%
jan 1, 1996
44.012
+2.446
5.88%
jan 1, 1997
44.559
+0.546
1.24%
jan 1, 1998
46.568
+2.01
4.51%
jan 1, 1999
46.909
+0.34
0.73%
jan 1, 2000
47.251
+0.342
0.73%
jan 1, 2001
51.747
+4.495
9.51%
jan 1, 2002
50.503
-1.243
-2.4%
jan 1, 2003
49.289
-1.214
-2.4%
jan 1, 2004
49.484
+0.195
0.4%
jan 1, 2005
52.312
+2.827
5.71%
jan 1, 2006
54.622
+2.31
4.42%
jan 1, 2007
57.718
+3.096
5.67%
jan 1, 2008
59.058
+1.341
2.32%
jan 1, 2009
61.569
+2.51
4.25%
jan 1, 2010
53.337
-8.232
-13.37%
jan 1, 2011
58.701
+5.364
10.06%
jan 1, 2012
62.713
+4.012
6.83%
jan 1, 2013
63.257
+0.544
0.87%
jan 1, 2014
63.172
-0.085
-0.13%
jan 1, 2015
63.223
+0.052
0.08%
jan 1, 2016
61.557
-1.666
-2.64%
Ranking of countries by current statistics by years


Comments: