29
/
en
AIzaSyAYiBZKx7MnpbEhh9jyipgxe19OcubqV5w
April 1, 2024
73535
Australia
AUS
true
2
1
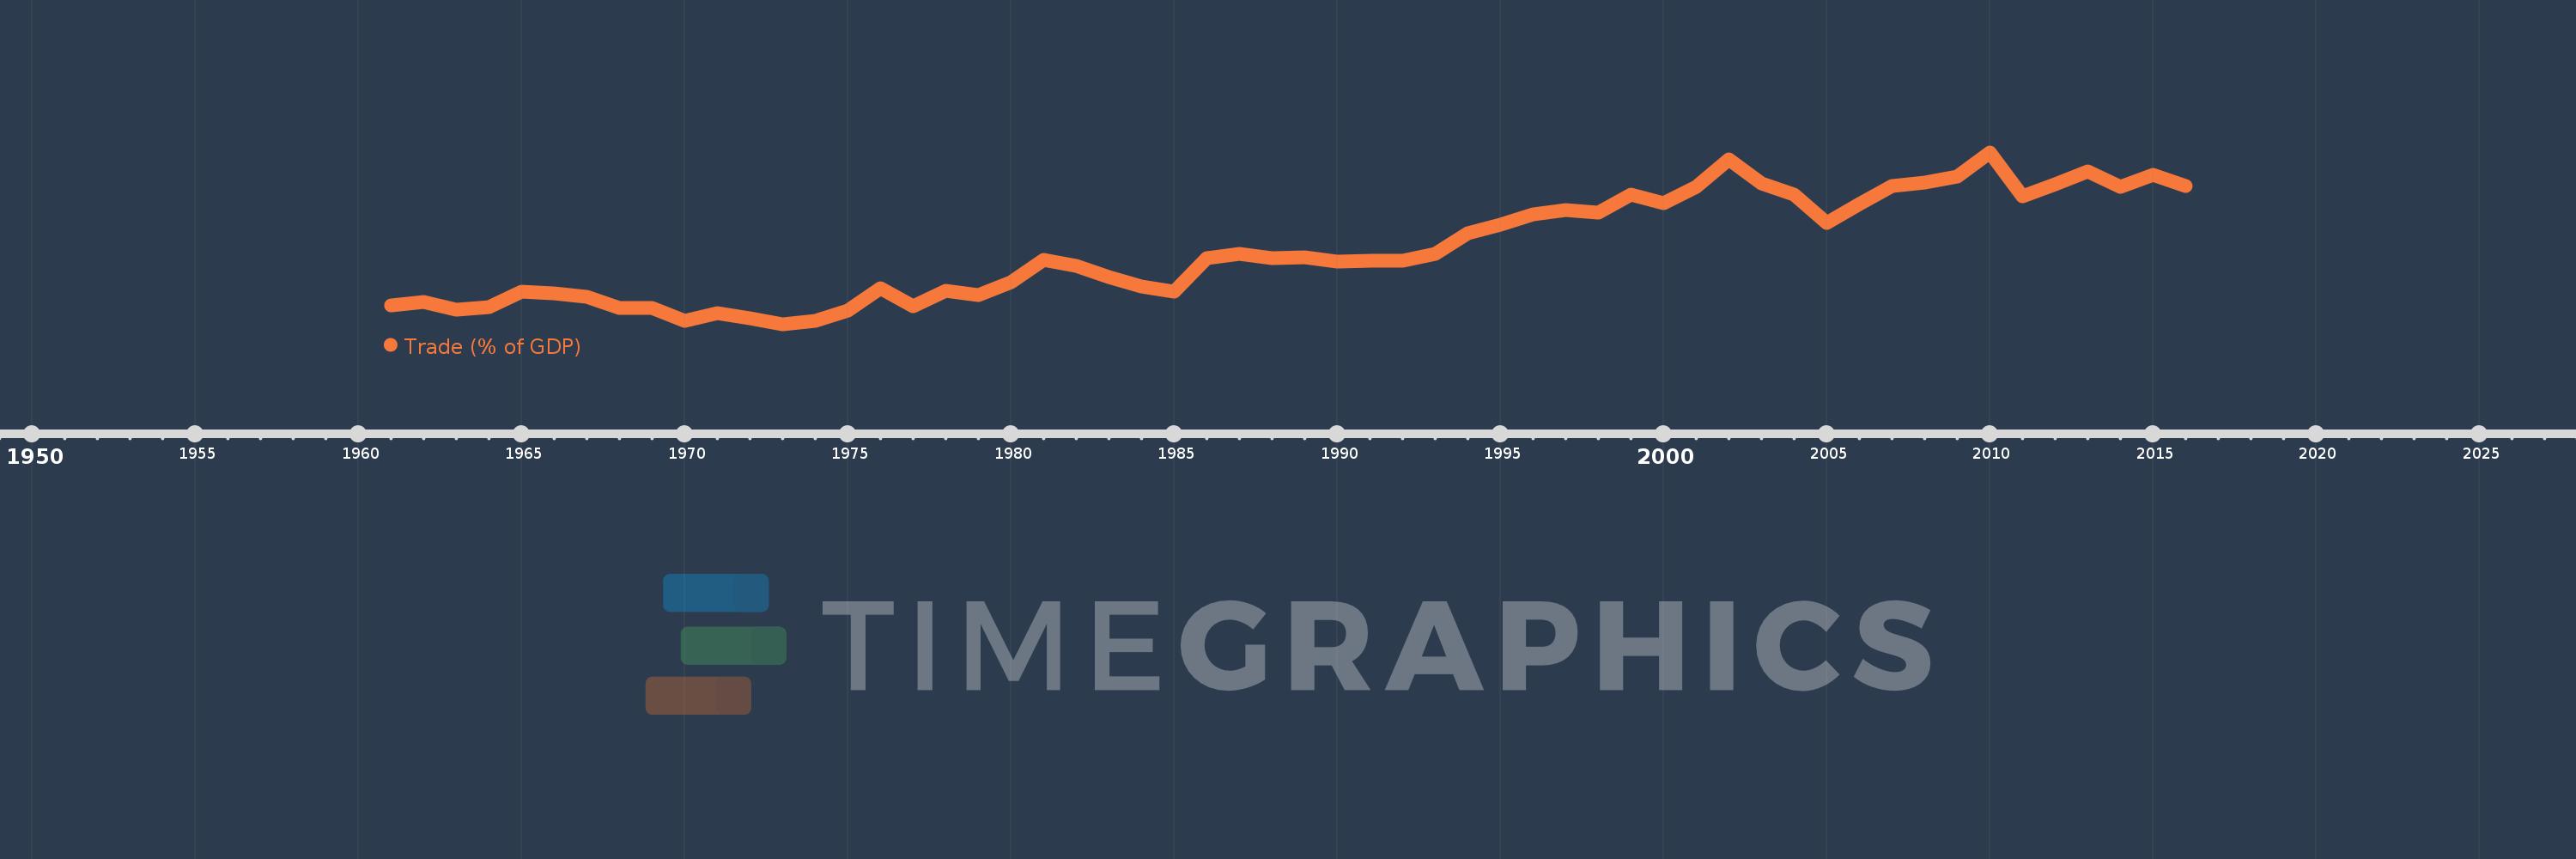
Trade (% of GDP)
2016,2015,2014,2013,2012,2011,2010,2009,2008,2007,2006,2005,2004,2003,2002,2001,2000,1999,1998,1997,1996,1995,1994,1993,1992,1991,1990,1989,1988,1987,1986,1985,1984,1983,1982,1981,1980,1979,1978,1977,1976,1975,1974,1973,1972,1971,1970,1969,1968,1967,1966,1965,1964,1963,1962,1961
This statistics in other country:
AfghanistanAlbaniaAlgeriaAngolaAntigua and BarbudaArab WorldArgentinaArmeniaArubaAustraliaAustriaAzerbaijanBahamas, TheBahrainBangladeshBarbadosBelarusBelgiumBelizeBeninBermudaBhutanBoliviaBosnia and HerzegovinaBotswanaBrazilBrunei DarussalamBulgariaBurkina FasoBurundiCabo VerdeCambodiaCameroonCanadaCaribbean small statesCentral African RepublicCentral Europe and the BalticsChadChileChinaColombiaComorosCongo, Dem. Rep.Congo, Rep.Costa RicaCote d'IvoireCroatiaCubaCyprusCzech RepublicDenmarkDjiboutiDominicaDominican RepublicEarly-demographic dividendEast Asia & PacificEast Asia & Pacific (excluding high income)East Asia & Pacific (IDA & IBRD countries)EcuadorEgypt, Arab Rep.El SalvadorEquatorial GuineaEritreaEstoniaEthiopiaEuro areaEurope & Central AsiaEurope & Central Asia (excluding high income)Europe & Central Asia (IDA & IBRD countries)European UnionFaroe IslandsFijiFinlandFragile and conflict affected situationsFranceFrench PolynesiaGabonGambia, TheGeorgiaGermanyGhanaGreeceGrenadaGuatemalaGuineaGuinea-BissauGuyanaHaitiHeavily indebted poor countries (HIPC)High incomeHondurasHong Kong SAR, ChinaHungaryIBRD onlyIcelandIDA & IBRD totalIDA blendIDA onlyIDA totalIndiaIndonesiaIran, Islamic Rep.IraqIrelandIsraelItalyJamaicaJapanJordanKazakhstanKenyaKiribatiKorea, Rep.KosovoKuwaitKyrgyz RepublicLao PDRLate-demographic dividendLatin America & Caribbean Latin America & Caribbean (excluding high income)Latin America & the Caribbean (IDA & IBRD countries)LatviaLeast developed countries: UN classificationLebanonLesothoLiberiaLibyaLithuaniaLow & middle incomeLow incomeLower middle incomeLuxembourgMacao SAR, ChinaMacedonia, FYRMadagascarMalawiMalaysiaMaldivesMaliMaltaMauritaniaMauritiusMexicoMicronesia, Fed. Sts.Middle East & North AfricaMiddle East & North Africa (excluding high income)Middle East & North Africa (IDA & IBRD countries)Middle incomeMoldovaMongoliaMontenegroMoroccoMozambiqueMyanmarNamibiaNepalNetherlandsNew CaledoniaNew ZealandNicaraguaNigerNigeriaNorth AmericaNorwayOECD membersOmanOther small statesPacific island small statesPakistanPalauPanamaPapua New GuineaParaguayPeruPhilippinesPolandPortugalPost-demographic dividendPre-demographic dividendPuerto RicoQatarRomaniaRussian FederationRwandaSamoaSaudi ArabiaSenegalSerbiaSeychellesSierra LeoneSingaporeSlovak RepublicSloveniaSmall statesSolomon IslandsSomaliaSouth AfricaSouth AsiaSouth Asia (IDA & IBRD)South SudanSpainSri LankaSt. Kitts and NevisSt. LuciaSt. Vincent and the GrenadinesSub-Saharan Africa Sub-Saharan Africa (excluding high income)Sub-Saharan Africa (IDA & IBRD countries)SudanSurinameSwazilandSwedenSwitzerlandSyrian Arab RepublicTajikistanTanzaniaThailandTimor-LesteTogoTongaTrinidad and TobagoTunisiaTurkeyTurkmenistanUgandaUkraineUnited Arab EmiratesUnited KingdomUnited StatesUpper middle incomeUruguayUzbekistanVanuatuVenezuela, RBVietnamWest Bank and GazaWorldYemen, Rep.ZambiaZimbabwe Timeline:
This timeline shows a graph from 1961 to 2016 of Australia. No data until 1960. Number of actual observations by date: 56.
Source name:
World Development Indicators
Source organization:
World Bank national accounts data, and OECD National Accounts data files.
Categories, topics:
Economy & Growth, Trade
Last updated:
apr 23, 2017
Indicators value changes by year
Maximum:
44.947
jan 1, 2010
At the date of observation
Value
Absolute change
Change from previous value
jan 1, 1961
27.064
+27.064
0.0%
jan 1, 1962
27.441
+0.376
1.39%
jan 1, 1963
26.58
-0.861
-3.14%
jan 1, 1964
26.846
+0.266
1.0%
jan 1, 1965
28.708
+1.863
6.94%
jan 1, 1966
28.494
-0.214
-0.75%
jan 1, 1967
28.074
-0.42
-1.47%
jan 1, 1968
26.787
-1.287
-4.58%
jan 1, 1969
26.796
+0.009
0.03%
jan 1, 1970
25.298
-1.498
-5.59%
jan 1, 1971
26.208
+0.91
3.6%
jan 1, 1972
25.609
-0.6
-2.29%
jan 1, 1973
24.87
-0.739
-2.88%
jan 1, 1974
25.251
+0.381
1.53%
jan 1, 1975
26.432
+1.181
4.68%
jan 1, 1976
29.075
+2.643
10.0%
jan 1, 1977
26.959
-2.116
-7.28%
jan 1, 1978
28.729
+1.771
6.57%
jan 1, 1979
28.276
-0.453
-1.58%
jan 1, 1980
29.735
+1.458
5.16%
jan 1, 1981
32.414
+2.68
9.01%
jan 1, 1982
31.709
-0.705
-2.17%
jan 1, 1983
30.425
-1.285
-4.05%
jan 1, 1984
29.275
-1.149
-3.78%
jan 1, 1985
28.625
-0.65
-2.22%
jan 1, 1986
32.608
+3.983
13.91%
jan 1, 1987
33.135
+0.527
1.62%
jan 1, 1988
32.619
-0.516
-1.56%
jan 1, 1989
32.655
+0.036
0.11%
jan 1, 1990
32.155
-0.5
-1.53%
jan 1, 1991
32.264
+0.109
0.34%
jan 1, 1992
32.294
+0.03
0.09%
jan 1, 1993
33.141
+0.848
2.62%
jan 1, 1994
35.476
+2.335
7.04%
jan 1, 1995
36.477
+1.001
2.82%
jan 1, 1996
37.731
+1.254
3.44%
jan 1, 1997
38.218
+0.487
1.29%
jan 1, 1998
37.95
-0.268
-0.7%
jan 1, 1999
39.972
+2.022
5.33%
jan 1, 2000
39.006
-0.966
-2.42%
jan 1, 2001
40.905
+1.898
4.87%
jan 1, 2002
44.118
+3.213
7.86%
jan 1, 2003
41.327
-2.791
-6.33%
jan 1, 2004
39.968
-1.359
-3.29%
jan 1, 2005
36.728
-3.24
-8.11%
jan 1, 2006
38.865
+2.137
5.82%
jan 1, 2007
41.017
+2.152
5.54%
jan 1, 2008
41.403
+0.385
0.94%
jan 1, 2009
42.118
+0.716
1.73%
jan 1, 2010
44.947
+2.829
6.72%
jan 1, 2011
39.86
-5.087
-11.32%
jan 1, 2012
41.244
+1.383
3.47%
jan 1, 2013
42.696
+1.452
3.52%
jan 1, 2014
40.889
-1.806
-4.23%
jan 1, 2015
42.302
+1.412
3.45%
jan 1, 2016
41.007
-1.295
-3.06%
Ranking of countries by current statistics by years


Comments: