29
/
en
AIzaSyAYiBZKx7MnpbEhh9jyipgxe19OcubqV5w
April 1, 2024
82324
Belgium
BEL
true
2
1
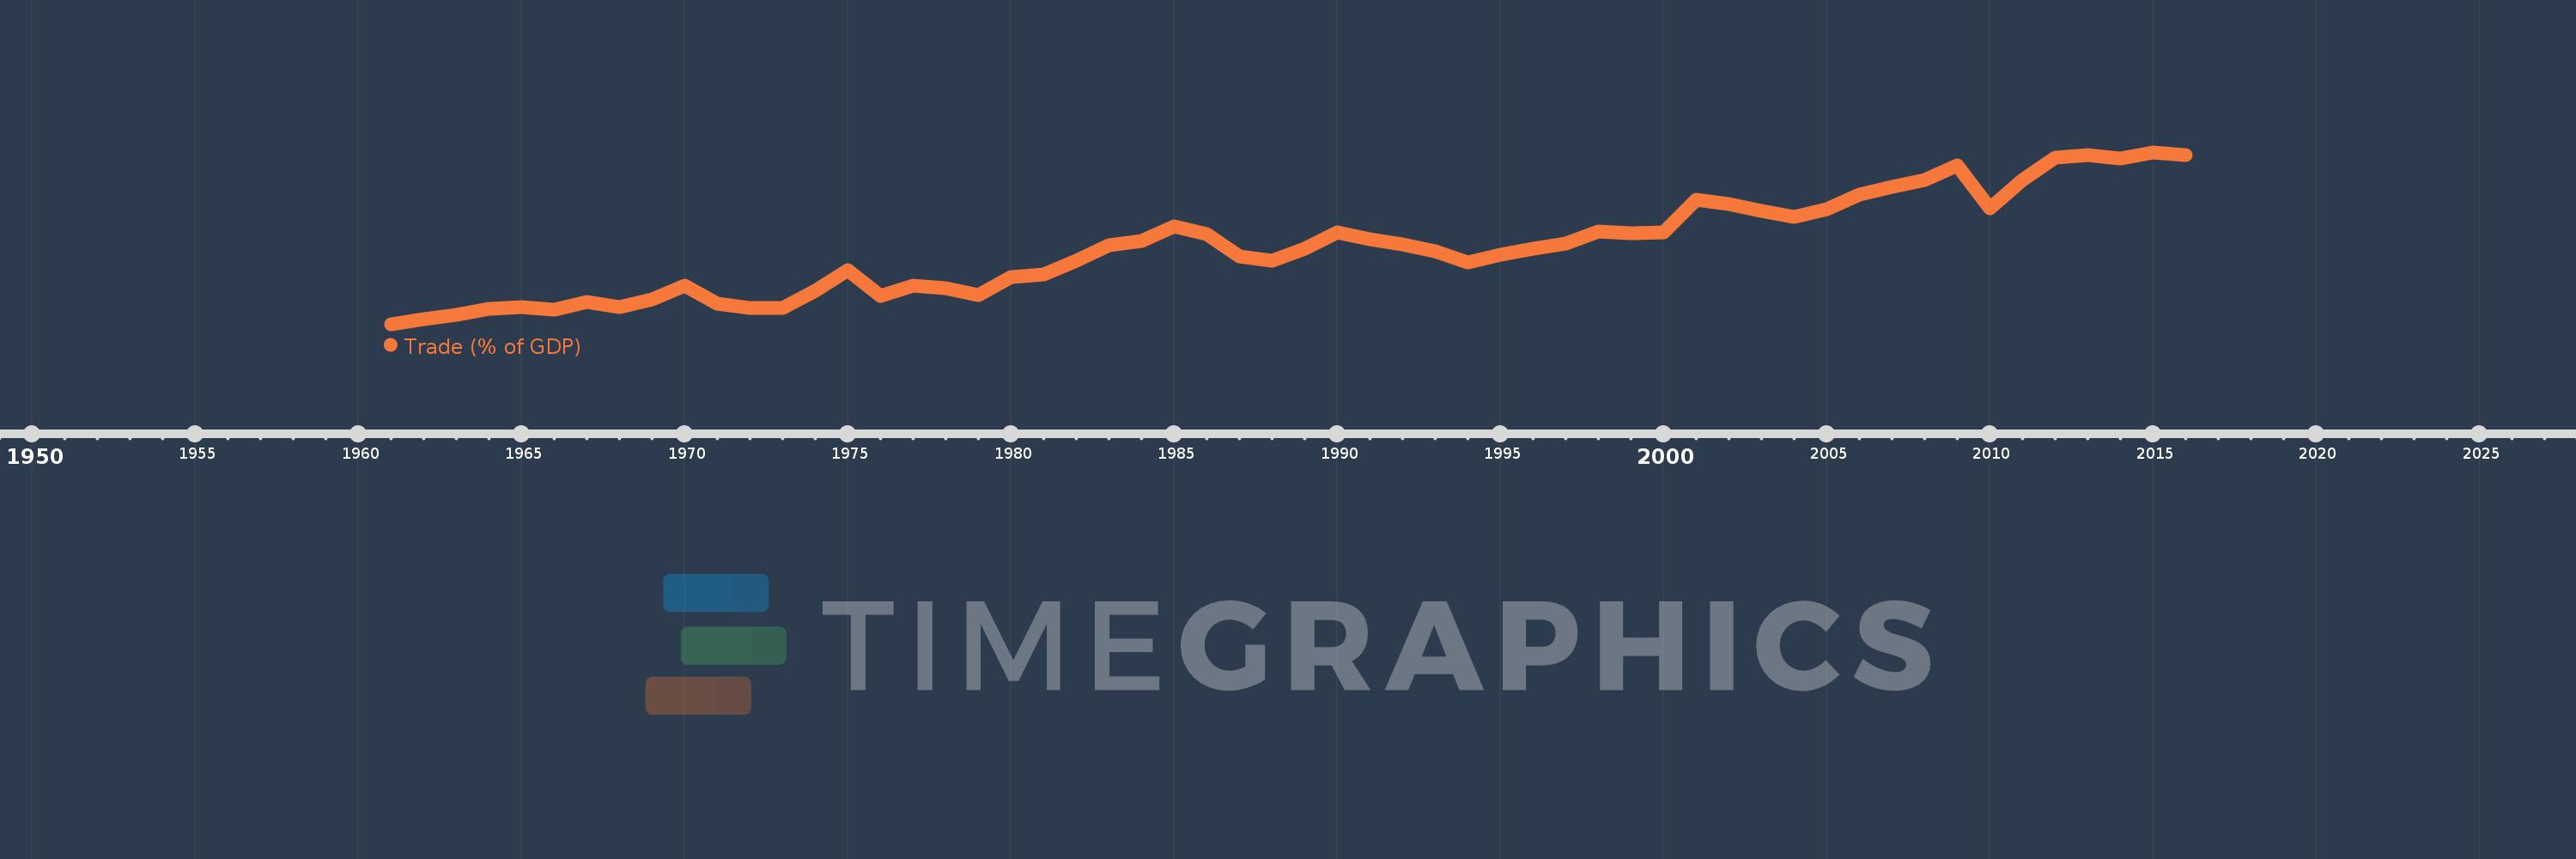
Trade (% of GDP)
2016,2015,2014,2013,2012,2011,2010,2009,2008,2007,2006,2005,2004,2003,2002,2001,2000,1999,1998,1997,1996,1995,1994,1993,1992,1991,1990,1989,1988,1987,1986,1985,1984,1983,1982,1981,1980,1979,1978,1977,1976,1975,1974,1973,1972,1971,1970,1969,1968,1967,1966,1965,1964,1963,1962,1961
This statistics in other country:
AfghanistanAlbaniaAlgeriaAngolaAntigua and BarbudaArab WorldArgentinaArmeniaArubaAustraliaAustriaAzerbaijanBahamas, TheBahrainBangladeshBarbadosBelarusBelgiumBelizeBeninBermudaBhutanBoliviaBosnia and HerzegovinaBotswanaBrazilBrunei DarussalamBulgariaBurkina FasoBurundiCabo VerdeCambodiaCameroonCanadaCaribbean small statesCentral African RepublicCentral Europe and the BalticsChadChileChinaColombiaComorosCongo, Dem. Rep.Congo, Rep.Costa RicaCote d'IvoireCroatiaCubaCyprusCzech RepublicDenmarkDjiboutiDominicaDominican RepublicEarly-demographic dividendEast Asia & PacificEast Asia & Pacific (excluding high income)East Asia & Pacific (IDA & IBRD countries)EcuadorEgypt, Arab Rep.El SalvadorEquatorial GuineaEritreaEstoniaEthiopiaEuro areaEurope & Central AsiaEurope & Central Asia (excluding high income)Europe & Central Asia (IDA & IBRD countries)European UnionFaroe IslandsFijiFinlandFragile and conflict affected situationsFranceFrench PolynesiaGabonGambia, TheGeorgiaGermanyGhanaGreeceGrenadaGuatemalaGuineaGuinea-BissauGuyanaHaitiHeavily indebted poor countries (HIPC)High incomeHondurasHong Kong SAR, ChinaHungaryIBRD onlyIcelandIDA & IBRD totalIDA blendIDA onlyIDA totalIndiaIndonesiaIran, Islamic Rep.IraqIrelandIsraelItalyJamaicaJapanJordanKazakhstanKenyaKiribatiKorea, Rep.KosovoKuwaitKyrgyz RepublicLao PDRLate-demographic dividendLatin America & Caribbean Latin America & Caribbean (excluding high income)Latin America & the Caribbean (IDA & IBRD countries)LatviaLeast developed countries: UN classificationLebanonLesothoLiberiaLibyaLithuaniaLow & middle incomeLow incomeLower middle incomeLuxembourgMacao SAR, ChinaMacedonia, FYRMadagascarMalawiMalaysiaMaldivesMaliMaltaMauritaniaMauritiusMexicoMicronesia, Fed. Sts.Middle East & North AfricaMiddle East & North Africa (excluding high income)Middle East & North Africa (IDA & IBRD countries)Middle incomeMoldovaMongoliaMontenegroMoroccoMozambiqueMyanmarNamibiaNepalNetherlandsNew CaledoniaNew ZealandNicaraguaNigerNigeriaNorth AmericaNorwayOECD membersOmanOther small statesPacific island small statesPakistanPalauPanamaPapua New GuineaParaguayPeruPhilippinesPolandPortugalPost-demographic dividendPre-demographic dividendPuerto RicoQatarRomaniaRussian FederationRwandaSamoaSaudi ArabiaSenegalSerbiaSeychellesSierra LeoneSingaporeSlovak RepublicSloveniaSmall statesSolomon IslandsSomaliaSouth AfricaSouth AsiaSouth Asia (IDA & IBRD)South SudanSpainSri LankaSt. Kitts and NevisSt. LuciaSt. Vincent and the GrenadinesSub-Saharan Africa Sub-Saharan Africa (excluding high income)Sub-Saharan Africa (IDA & IBRD countries)SudanSurinameSwazilandSwedenSwitzerlandSyrian Arab RepublicTajikistanTanzaniaThailandTimor-LesteTogoTongaTrinidad and TobagoTunisiaTurkeyTurkmenistanUgandaUkraineUnited Arab EmiratesUnited KingdomUnited StatesUpper middle incomeUruguayUzbekistanVanuatuVenezuela, RBVietnamWest Bank and GazaWorldYemen, Rep.ZambiaZimbabwe Timeline:
This timeline shows a graph from 1961 to 2016 of Belgium. No data until 1960. Number of actual observations by date: 56.
Source name:
World Development Indicators
Source organization:
World Bank national accounts data, and OECD National Accounts data files.
Categories, topics:
Economy & Growth, Trade
Last updated:
apr 23, 2017
Indicators value changes by year
Minimum:
76.301
jan 1, 1961
Maximum:
165.488
jan 1, 2015
At the date of observation
Value
Absolute change
Change from previous value
jan 1, 1961
76.301
+76.301
0.0%
jan 1, 1962
78.818
+2.517
3.3%
jan 1, 1963
81.158
+2.339
2.97%
jan 1, 1964
84.383
+3.225
3.97%
jan 1, 1965
85.327
+0.944
1.12%
jan 1, 1966
83.99
-1.337
-1.57%
jan 1, 1967
88.036
+4.046
4.82%
jan 1, 1968
84.954
-3.081
-3.5%
jan 1, 1969
89.273
+4.318
5.08%
jan 1, 1970
96.491
+7.219
8.09%
jan 1, 1971
87.076
-9.415
-9.76%
jan 1, 1972
84.949
-2.127
-2.44%
jan 1, 1973
84.579
-0.37
-0.44%
jan 1, 1974
93.446
+8.868
10.48%
jan 1, 1975
104.496
+11.05
11.82%
jan 1, 1976
90.85
-13.646
-13.06%
jan 1, 1977
96.103
+5.253
5.78%
jan 1, 1978
94.976
-1.127
-1.17%
jan 1, 1979
91.637
-3.34
-3.52%
jan 1, 1980
100.832
+9.195
10.03%
jan 1, 1981
102.307
+1.475
1.46%
jan 1, 1982
109.418
+7.111
6.95%
jan 1, 1983
117.064
+7.646
6.99%
jan 1, 1984
119.509
+2.446
2.09%
jan 1, 1985
127.286
+7.777
6.51%
jan 1, 1986
122.963
-4.323
-3.4%
jan 1, 1987
111.495
-11.469
-9.33%
jan 1, 1988
109.106
-2.389
-2.14%
jan 1, 1989
115.56
+6.454
5.92%
jan 1, 1990
124.012
+8.452
7.31%
jan 1, 1991
120.57
-3.442
-2.78%
jan 1, 1992
117.713
-2.857
-2.37%
jan 1, 1993
114.216
-3.497
-2.97%
jan 1, 1994
108.202
-6.014
-5.27%
jan 1, 1995
112.389
+4.187
3.87%
jan 1, 1996
115.511
+3.122
2.78%
jan 1, 1997
118.06
+2.549
2.21%
jan 1, 1998
124.367
+6.307
5.34%
jan 1, 1999
123.484
-0.882
-0.71%
jan 1, 2000
123.997
+0.513
0.42%
jan 1, 2001
141.079
+17.082
13.78%
jan 1, 2002
138.694
-2.385
-1.69%
jan 1, 2003
135.125
-3.57
-2.57%
jan 1, 2004
131.99
-3.135
-2.32%
jan 1, 2005
136.038
+4.048
3.07%
jan 1, 2006
143.376
+7.338
5.39%
jan 1, 2007
147.694
+4.318
3.01%
jan 1, 2008
151.164
+3.47
2.35%
jan 1, 2009
158.908
+7.744
5.12%
jan 1, 2010
136.357
-22.551
-14.19%
jan 1, 2011
151.1
+14.743
10.81%
jan 1, 2012
162.754
+11.653
7.71%
jan 1, 2013
163.995
+1.241
0.76%
jan 1, 2014
162.479
-1.516
-0.92%
jan 1, 2015
165.488
+3.009
1.85%
jan 1, 2016
164.186
-1.302
-0.79%
Ranking of countries by current statistics by years


Comments: