29
/
en
AIzaSyAYiBZKx7MnpbEhh9jyipgxe19OcubqV5w
April 1, 2024
220326
Papua New Guinea
PNG
true
2
1
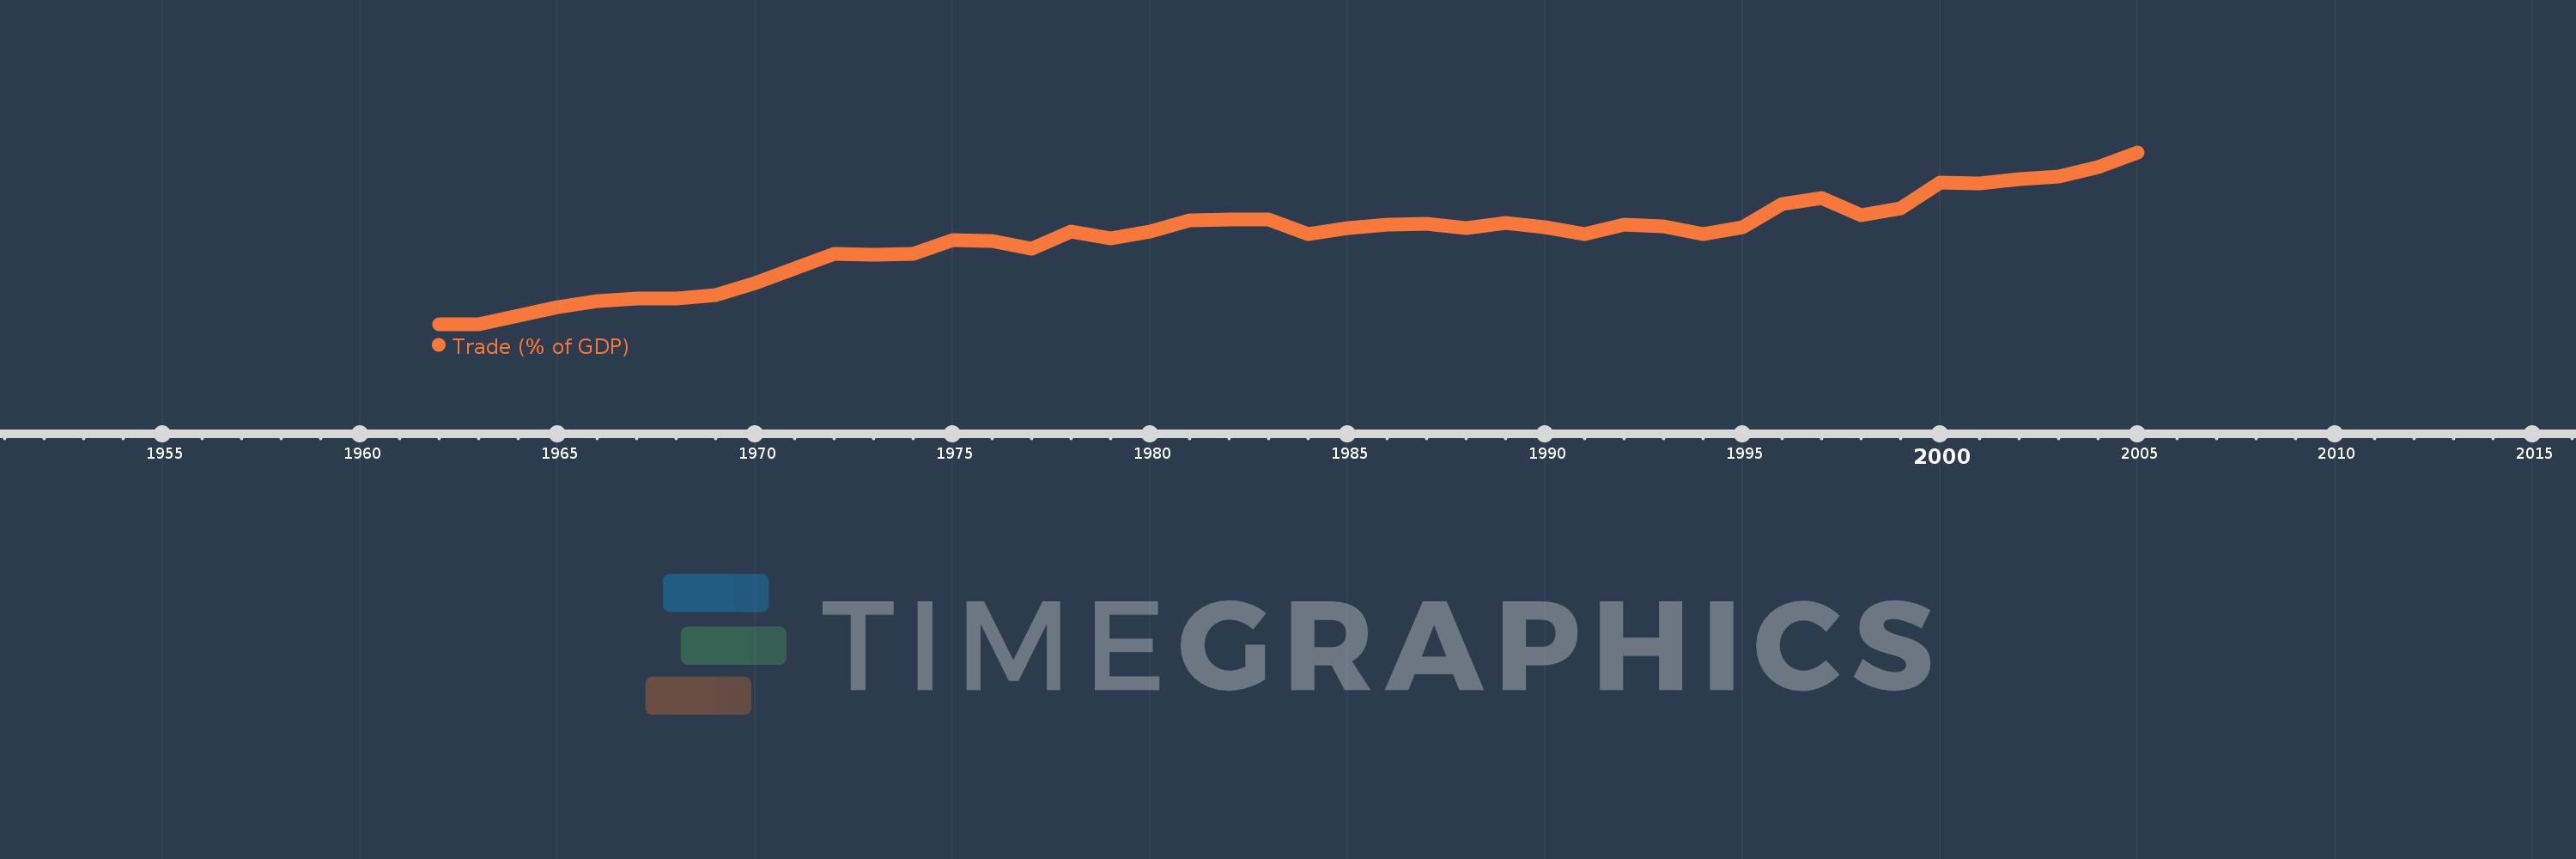
Trade (% of GDP)
2005,2004,2003,2002,2001,2000,1999,1998,1997,1996,1995,1994,1993,1992,1991,1990,1989,1988,1987,1986,1985,1984,1983,1982,1981,1980,1979,1978,1977,1976,1975,1974,1973,1972,1971,1970,1969,1968,1967,1966,1965,1964,1963,1962
This statistics in other country:
AfghanistanAlbaniaAlgeriaAngolaAntigua and BarbudaArab WorldArgentinaArmeniaArubaAustraliaAustriaAzerbaijanBahamas, TheBahrainBangladeshBarbadosBelarusBelgiumBelizeBeninBermudaBhutanBoliviaBosnia and HerzegovinaBotswanaBrazilBrunei DarussalamBulgariaBurkina FasoBurundiCabo VerdeCambodiaCameroonCanadaCaribbean small statesCentral African RepublicCentral Europe and the BalticsChadChileChinaColombiaComorosCongo, Dem. Rep.Congo, Rep.Costa RicaCote d'IvoireCroatiaCubaCyprusCzech RepublicDenmarkDjiboutiDominicaDominican RepublicEarly-demographic dividendEast Asia & PacificEast Asia & Pacific (excluding high income)East Asia & Pacific (IDA & IBRD countries)EcuadorEgypt, Arab Rep.El SalvadorEquatorial GuineaEritreaEstoniaEthiopiaEuro areaEurope & Central AsiaEurope & Central Asia (excluding high income)Europe & Central Asia (IDA & IBRD countries)European UnionFaroe IslandsFijiFinlandFragile and conflict affected situationsFranceFrench PolynesiaGabonGambia, TheGeorgiaGermanyGhanaGreeceGrenadaGuatemalaGuineaGuinea-BissauGuyanaHaitiHeavily indebted poor countries (HIPC)High incomeHondurasHong Kong SAR, ChinaHungaryIBRD onlyIcelandIDA & IBRD totalIDA blendIDA onlyIDA totalIndiaIndonesiaIran, Islamic Rep.IraqIrelandIsraelItalyJamaicaJapanJordanKazakhstanKenyaKiribatiKorea, Rep.KosovoKuwaitKyrgyz RepublicLao PDRLate-demographic dividendLatin America & Caribbean Latin America & Caribbean (excluding high income)Latin America & the Caribbean (IDA & IBRD countries)LatviaLeast developed countries: UN classificationLebanonLesothoLiberiaLibyaLithuaniaLow & middle incomeLow incomeLower middle incomeLuxembourgMacao SAR, ChinaMacedonia, FYRMadagascarMalawiMalaysiaMaldivesMaliMaltaMauritaniaMauritiusMexicoMicronesia, Fed. Sts.Middle East & North AfricaMiddle East & North Africa (excluding high income)Middle East & North Africa (IDA & IBRD countries)Middle incomeMoldovaMongoliaMontenegroMoroccoMozambiqueMyanmarNamibiaNepalNetherlandsNew CaledoniaNew ZealandNicaraguaNigerNigeriaNorth AmericaNorwayOECD membersOmanOther small statesPacific island small statesPakistanPalauPanamaPapua New GuineaParaguayPeruPhilippinesPolandPortugalPost-demographic dividendPre-demographic dividendPuerto RicoQatarRomaniaRussian FederationRwandaSamoaSaudi ArabiaSenegalSerbiaSeychellesSierra LeoneSingaporeSlovak RepublicSloveniaSmall statesSolomon IslandsSomaliaSouth AfricaSouth AsiaSouth Asia (IDA & IBRD)South SudanSpainSri LankaSt. Kitts and NevisSt. LuciaSt. Vincent and the GrenadinesSub-Saharan Africa Sub-Saharan Africa (excluding high income)Sub-Saharan Africa (IDA & IBRD countries)SudanSurinameSwazilandSwedenSwitzerlandSyrian Arab RepublicTajikistanTanzaniaThailandTimor-LesteTogoTongaTrinidad and TobagoTunisiaTurkeyTurkmenistanUgandaUkraineUnited Arab EmiratesUnited KingdomUnited StatesUpper middle incomeUruguayUzbekistanVanuatuVenezuela, RBVietnamWest Bank and GazaWorldYemen, Rep.ZambiaZimbabwe Timeline:
This timeline shows a graph from 1962 to 2005 of Papua New Guinea. No data until 1961. Number of actual observations by date: 44.
Source name:
World Development Indicators
Source organization:
World Bank national accounts data, and OECD National Accounts data files.
Categories, topics:
Economy & Growth, Trade
Last updated:
apr 23, 2017
Indicators value changes by year
Minimum:
44.125
jan 1, 1963
Maximum:
131.083
jan 1, 2005
At the date of observation
Value
Absolute change
Change from previous value
jan 1, 1962
44.236
+44.236
0.0%
jan 1, 1963
44.125
-0.111
-0.25%
jan 1, 1964
48.377
+4.251
9.63%
jan 1, 1965
52.605
+4.228
8.74%
jan 1, 1966
56.004
+3.399
6.46%
jan 1, 1967
56.918
+0.914
1.63%
jan 1, 1968
56.998
+0.08
0.14%
jan 1, 1969
58.934
+1.936
3.4%
jan 1, 1970
64.811
+5.878
9.97%
jan 1, 1971
72.415
+7.604
11.73%
jan 1, 1972
79.609
+7.194
9.93%
jan 1, 1973
79.459
-0.15
-0.19%
jan 1, 1974
79.698
+0.239
0.3%
jan 1, 1975
86.726
+7.028
8.82%
jan 1, 1976
86.143
-0.583
-0.67%
jan 1, 1977
82.555
-3.588
-4.17%
jan 1, 1978
91.244
+8.689
10.53%
jan 1, 1979
87.356
-3.888
-4.26%
jan 1, 1980
91.069
+3.713
4.25%
jan 1, 1981
96.505
+5.435
5.97%
jan 1, 1982
96.984
+0.479
0.5%
jan 1, 1983
97.33
+0.346
0.36%
jan 1, 1984
89.648
-7.683
-7.89%
jan 1, 1985
92.588
+2.941
3.28%
jan 1, 1986
94.555
+1.966
2.12%
jan 1, 1987
94.934
+0.38
0.4%
jan 1, 1988
92.839
-2.096
-2.21%
jan 1, 1989
95.174
+2.335
2.51%
jan 1, 1990
93.394
-1.78
-1.87%
jan 1, 1991
89.572
-3.822
-4.09%
jan 1, 1992
94.42
+4.848
5.41%
jan 1, 1993
93.552
-0.868
-0.92%
jan 1, 1994
89.589
-3.963
-4.24%
jan 1, 1995
93.303
+3.713
4.14%
jan 1, 1996
104.74
+11.437
12.26%
jan 1, 1997
107.803
+3.063
2.92%
jan 1, 1998
99.208
-8.595
-7.97%
jan 1, 1999
102.861
+3.653
3.68%
jan 1, 2000
116.007
+13.146
12.78%
jan 1, 2001
115.422
-0.585
-0.5%
jan 1, 2002
117.58
+2.159
1.87%
jan 1, 2003
118.919
+1.339
1.14%
jan 1, 2004
123.449
+4.53
3.81%
jan 1, 2005
131.083
+7.634
6.18%
Ranking of countries by current statistics by years


Comments: