29
/
en
AIzaSyAYiBZKx7MnpbEhh9jyipgxe19OcubqV5w
April 1, 2024
202398
Morocco
MAR
true
2
1
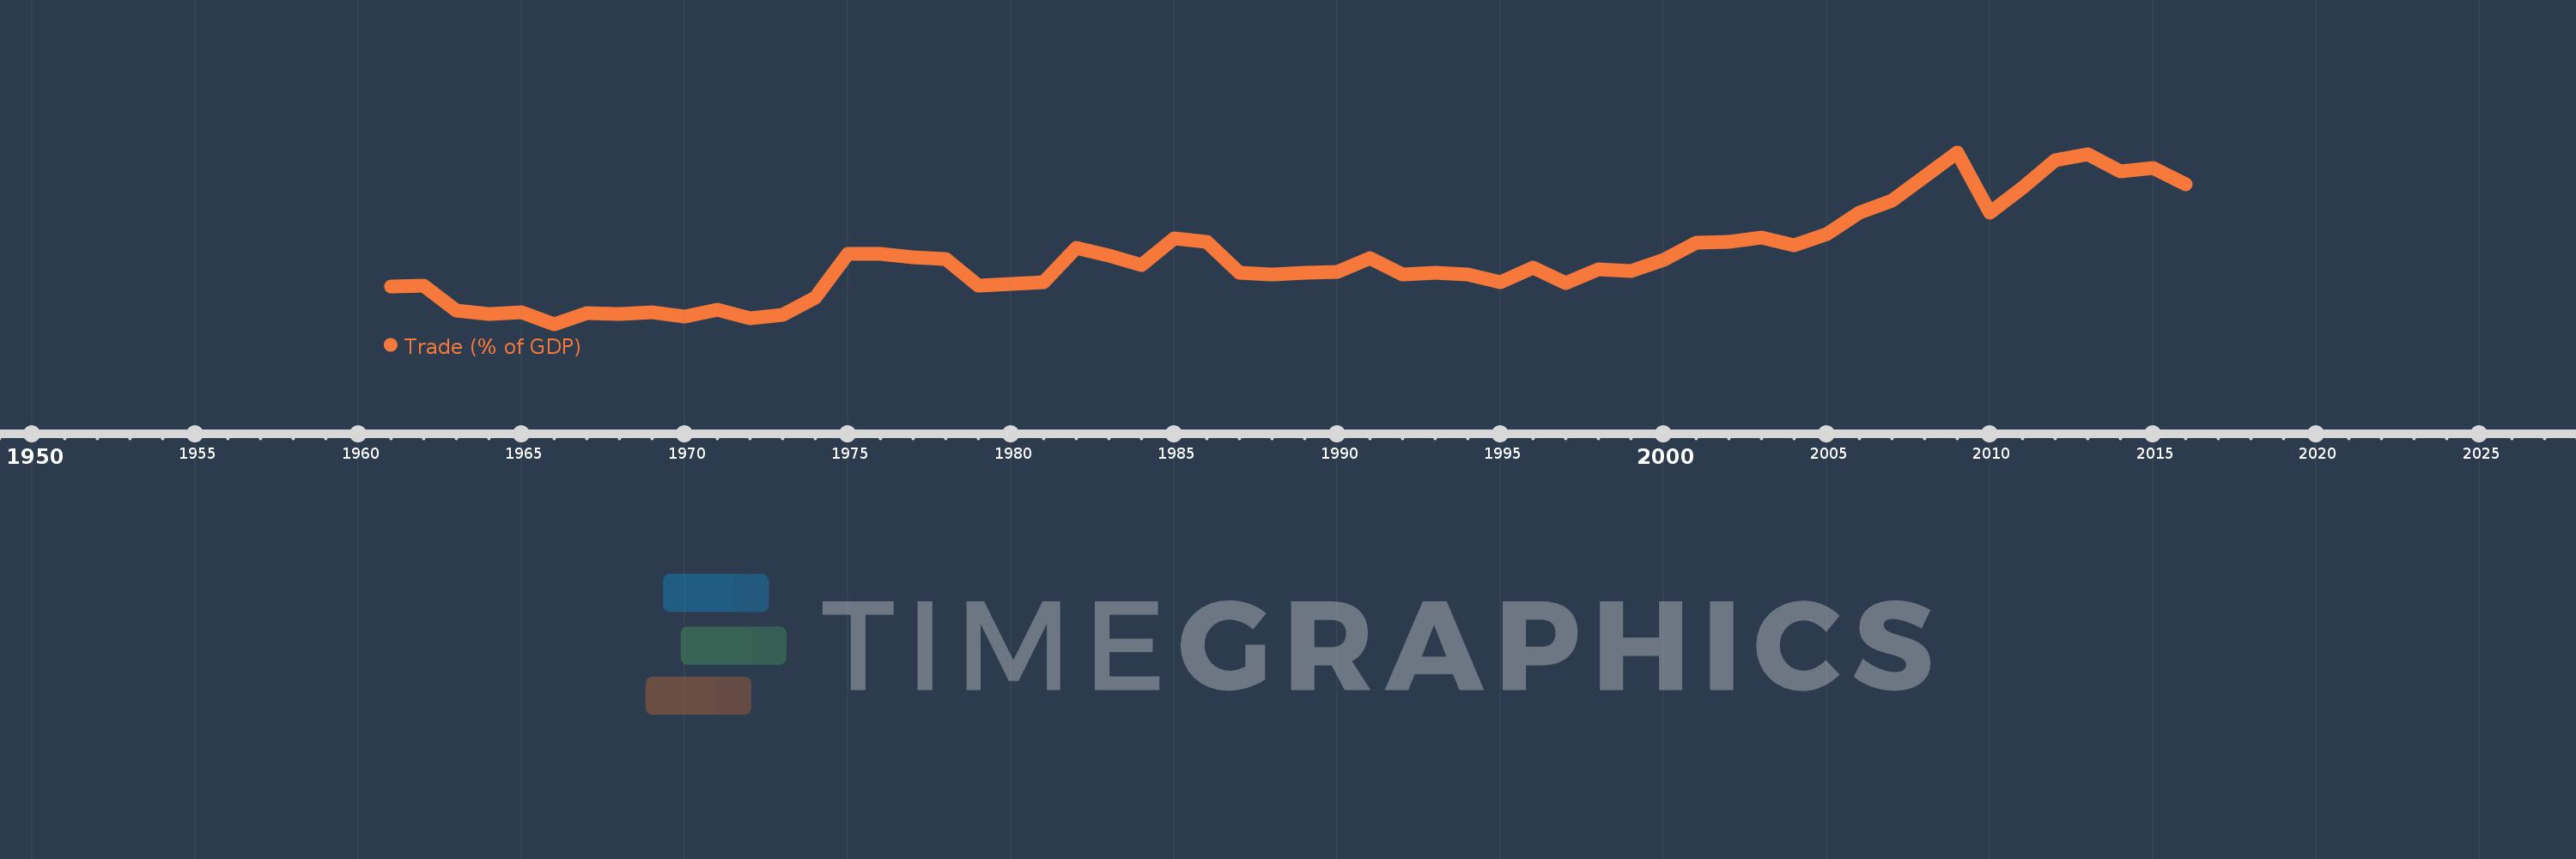
Trade (% of GDP)
2016,2015,2014,2013,2012,2011,2010,2009,2008,2007,2006,2005,2004,2003,2002,2001,2000,1999,1998,1997,1996,1995,1994,1993,1992,1991,1990,1989,1988,1987,1986,1985,1984,1983,1982,1981,1980,1979,1978,1977,1976,1975,1974,1973,1972,1971,1970,1969,1968,1967,1966,1965,1964,1963,1962,1961
This statistics in other country:
AfghanistanAlbaniaAlgeriaAngolaAntigua and BarbudaArab WorldArgentinaArmeniaArubaAustraliaAustriaAzerbaijanBahamas, TheBahrainBangladeshBarbadosBelarusBelgiumBelizeBeninBermudaBhutanBoliviaBosnia and HerzegovinaBotswanaBrazilBrunei DarussalamBulgariaBurkina FasoBurundiCabo VerdeCambodiaCameroonCanadaCaribbean small statesCentral African RepublicCentral Europe and the BalticsChadChileChinaColombiaComorosCongo, Dem. Rep.Congo, Rep.Costa RicaCote d'IvoireCroatiaCubaCyprusCzech RepublicDenmarkDjiboutiDominicaDominican RepublicEarly-demographic dividendEast Asia & PacificEast Asia & Pacific (excluding high income)East Asia & Pacific (IDA & IBRD countries)EcuadorEgypt, Arab Rep.El SalvadorEquatorial GuineaEritreaEstoniaEthiopiaEuro areaEurope & Central AsiaEurope & Central Asia (excluding high income)Europe & Central Asia (IDA & IBRD countries)European UnionFaroe IslandsFijiFinlandFragile and conflict affected situationsFranceFrench PolynesiaGabonGambia, TheGeorgiaGermanyGhanaGreeceGrenadaGuatemalaGuineaGuinea-BissauGuyanaHaitiHeavily indebted poor countries (HIPC)High incomeHondurasHong Kong SAR, ChinaHungaryIBRD onlyIcelandIDA & IBRD totalIDA blendIDA onlyIDA totalIndiaIndonesiaIran, Islamic Rep.IraqIrelandIsraelItalyJamaicaJapanJordanKazakhstanKenyaKiribatiKorea, Rep.KosovoKuwaitKyrgyz RepublicLao PDRLate-demographic dividendLatin America & Caribbean Latin America & Caribbean (excluding high income)Latin America & the Caribbean (IDA & IBRD countries)LatviaLeast developed countries: UN classificationLebanonLesothoLiberiaLibyaLithuaniaLow & middle incomeLow incomeLower middle incomeLuxembourgMacao SAR, ChinaMacedonia, FYRMadagascarMalawiMalaysiaMaldivesMaliMaltaMauritaniaMauritiusMexicoMicronesia, Fed. Sts.Middle East & North AfricaMiddle East & North Africa (excluding high income)Middle East & North Africa (IDA & IBRD countries)Middle incomeMoldovaMongoliaMontenegroMoroccoMozambiqueMyanmarNamibiaNepalNetherlandsNew CaledoniaNew ZealandNicaraguaNigerNigeriaNorth AmericaNorwayOECD membersOmanOther small statesPacific island small statesPakistanPalauPanamaPapua New GuineaParaguayPeruPhilippinesPolandPortugalPost-demographic dividendPre-demographic dividendPuerto RicoQatarRomaniaRussian FederationRwandaSamoaSaudi ArabiaSenegalSerbiaSeychellesSierra LeoneSingaporeSlovak RepublicSloveniaSmall statesSolomon IslandsSomaliaSouth AfricaSouth AsiaSouth Asia (IDA & IBRD)South SudanSpainSri LankaSt. Kitts and NevisSt. LuciaSt. Vincent and the GrenadinesSub-Saharan Africa Sub-Saharan Africa (excluding high income)Sub-Saharan Africa (IDA & IBRD countries)SudanSurinameSwazilandSwedenSwitzerlandSyrian Arab RepublicTajikistanTanzaniaThailandTimor-LesteTogoTongaTrinidad and TobagoTunisiaTurkeyTurkmenistanUgandaUkraineUnited Arab EmiratesUnited KingdomUnited StatesUpper middle incomeUruguayUzbekistanVanuatuVenezuela, RBVietnamWest Bank and GazaWorldYemen, Rep.ZambiaZimbabwe Timeline:
This timeline shows a graph from 1961 to 2016 of Morocco. No data until 1960. Number of actual observations by date: 56.
Source name:
World Development Indicators
Source organization:
World Bank national accounts data, and OECD National Accounts data files.
Categories, topics:
Economy & Growth, Trade
Last updated:
apr 23, 2017
Indicators value changes by year
Minimum:
35.054
jan 1, 1966
Maximum:
85.673
jan 1, 2009
At the date of observation
Value
Absolute change
Change from previous value
jan 1, 1961
46.27
+46.27
0.0%
jan 1, 1962
46.532
+0.262
0.57%
jan 1, 1963
39.113
-7.419
-15.94%
jan 1, 1964
38.001
-1.112
-2.84%
jan 1, 1965
38.627
+0.626
1.65%
jan 1, 1966
35.054
-3.574
-9.25%
jan 1, 1967
38.335
+3.281
9.36%
jan 1, 1968
38.077
-0.257
-0.67%
jan 1, 1969
38.538
+0.461
1.21%
jan 1, 1970
37.21
-1.328
-3.45%
jan 1, 1971
39.216
+2.007
5.39%
jan 1, 1972
36.679
-2.537
-6.47%
jan 1, 1973
37.797
+1.118
3.05%
jan 1, 1974
42.943
+5.146
13.61%
jan 1, 1975
55.749
+12.807
29.82%
jan 1, 1976
55.819
+0.07
0.12%
jan 1, 1977
54.644
-1.174
-2.1%
jan 1, 1978
54.217
-0.427
-0.78%
jan 1, 1979
46.439
-7.778
-14.35%
jan 1, 1980
46.875
+0.436
0.94%
jan 1, 1981
47.342
+0.467
1.0%
jan 1, 1982
57.436
+10.094
21.32%
jan 1, 1983
55.34
-2.096
-3.65%
jan 1, 1984
52.614
-2.726
-4.93%
jan 1, 1985
60.363
+7.749
14.73%
jan 1, 1986
59.315
-1.048
-1.74%
jan 1, 1987
50.281
-9.034
-15.23%
jan 1, 1988
49.658
-0.623
-1.24%
jan 1, 1989
50.138
+0.48
0.97%
jan 1, 1990
50.351
+0.213
0.43%
jan 1, 1991
54.627
+4.276
8.49%
jan 1, 1992
49.779
-4.847
-8.87%
jan 1, 1993
50.263
+0.484
0.97%
jan 1, 1994
49.668
-0.595
-1.18%
jan 1, 1995
47.314
-2.355
-4.74%
jan 1, 1996
51.715
+4.401
9.3%
jan 1, 1997
47.096
-4.619
-8.93%
jan 1, 1998
51.15
+4.055
8.61%
jan 1, 1999
50.798
-0.352
-0.69%
jan 1, 2000
53.987
+3.189
6.28%
jan 1, 2001
59.162
+5.175
9.59%
jan 1, 2002
59.418
+0.256
0.43%
jan 1, 2003
60.534
+1.116
1.88%
jan 1, 2004
58.328
-2.206
-3.64%
jan 1, 2005
61.597
+3.269
5.6%
jan 1, 2006
67.915
+6.318
10.26%
jan 1, 2007
71.496
+3.581
5.27%
jan 1, 2008
78.487
+6.991
9.78%
jan 1, 2009
85.673
+7.186
9.16%
jan 1, 2010
67.915
-17.758
-20.73%
jan 1, 2011
75.248
+7.333
10.8%
jan 1, 2012
83.427
+8.179
10.87%
jan 1, 2013
85.125
+1.698
2.04%
jan 1, 2014
80.021
-5.104
-6.0%
jan 1, 2015
81.177
+1.156
1.45%
jan 1, 2016
76.379
-4.798
-5.91%
Ranking of countries by current statistics by years


Comments: