29
/
en
AIzaSyAYiBZKx7MnpbEhh9jyipgxe19OcubqV5w
April 1, 2024
91971
Brazil
BRA
true
2
1
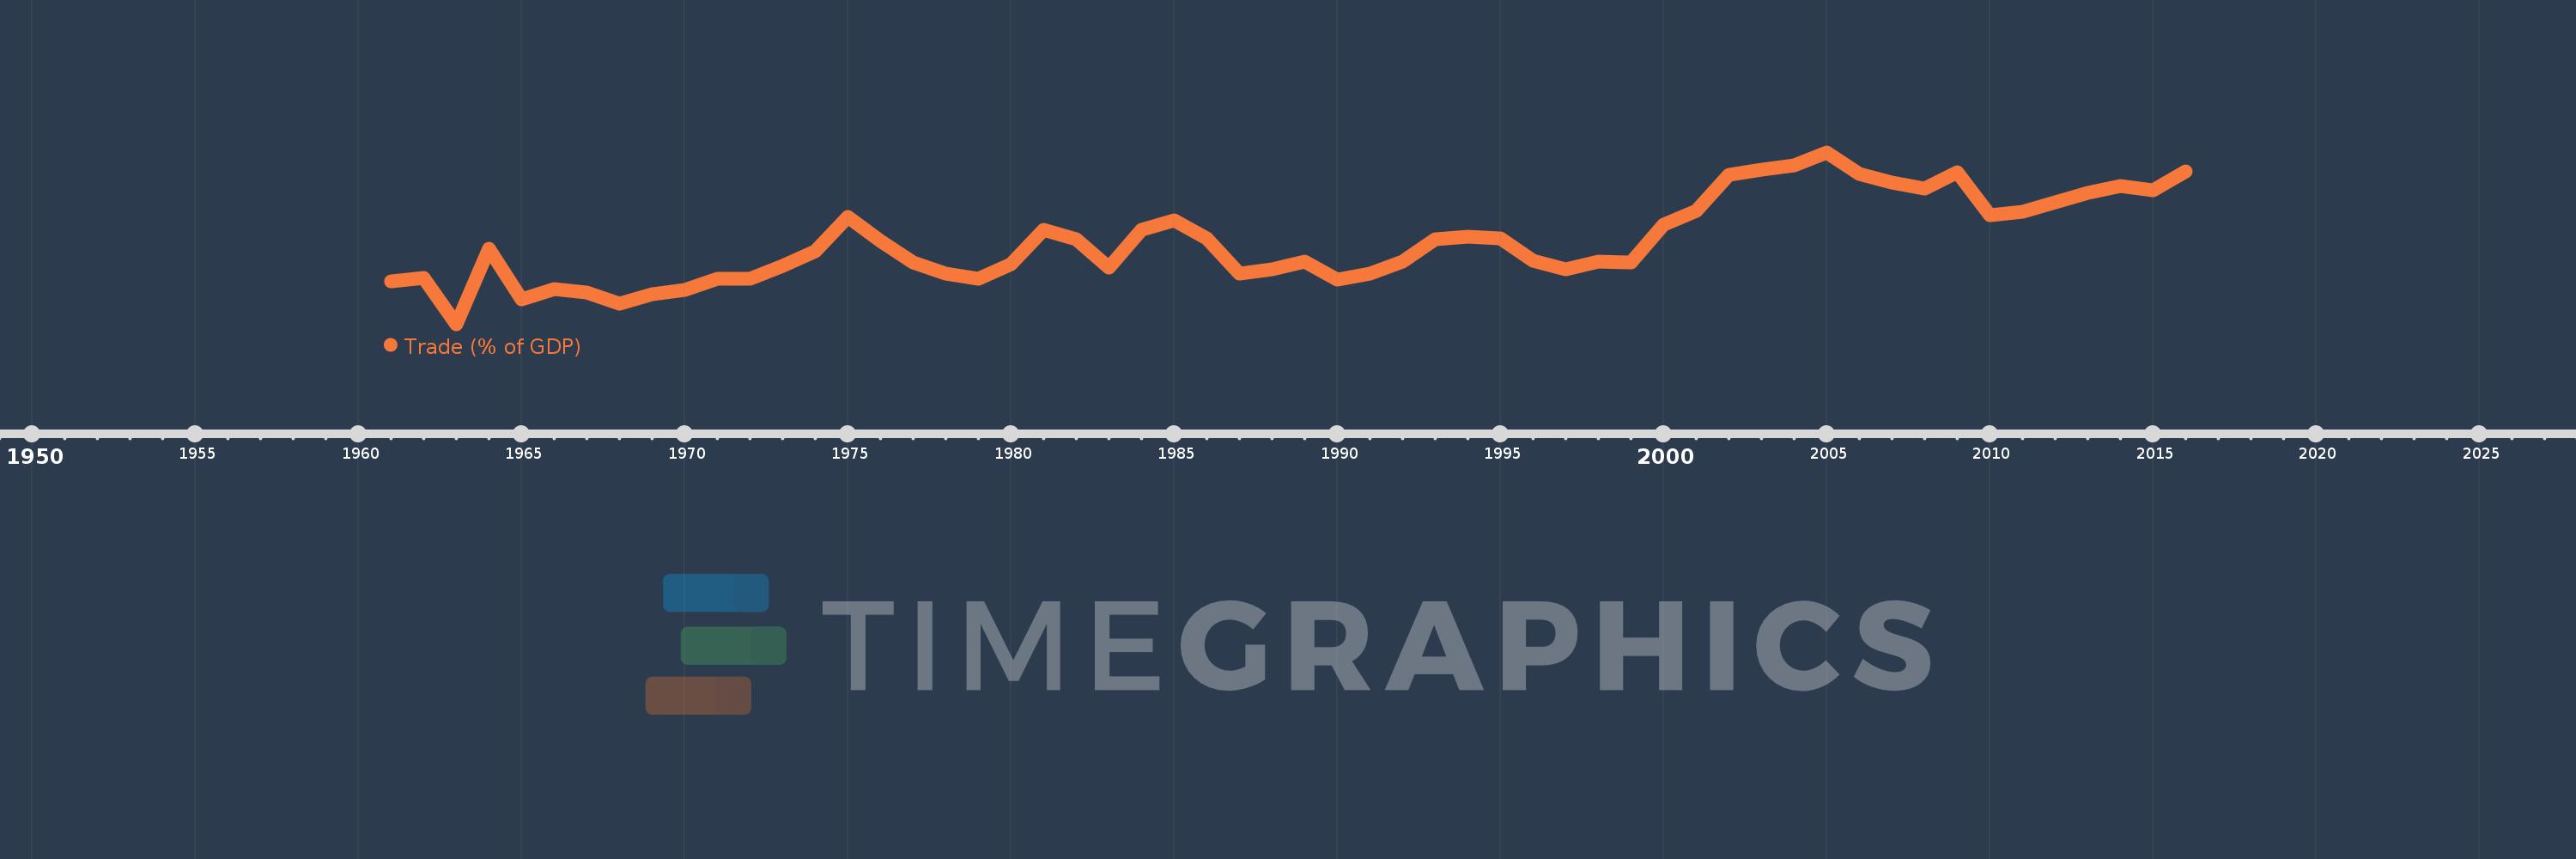
Trade (% of GDP)
2016,2015,2014,2013,2012,2011,2010,2009,2008,2007,2006,2005,2004,2003,2002,2001,2000,1999,1998,1997,1996,1995,1994,1993,1992,1991,1990,1989,1988,1987,1986,1985,1984,1983,1982,1981,1980,1979,1978,1977,1976,1975,1974,1973,1972,1971,1970,1969,1968,1967,1966,1965,1964,1963,1962,1961
This statistics in other country:
AfghanistanAlbaniaAlgeriaAngolaAntigua and BarbudaArab WorldArgentinaArmeniaArubaAustraliaAustriaAzerbaijanBahamas, TheBahrainBangladeshBarbadosBelarusBelgiumBelizeBeninBermudaBhutanBoliviaBosnia and HerzegovinaBotswanaBrazilBrunei DarussalamBulgariaBurkina FasoBurundiCabo VerdeCambodiaCameroonCanadaCaribbean small statesCentral African RepublicCentral Europe and the BalticsChadChileChinaColombiaComorosCongo, Dem. Rep.Congo, Rep.Costa RicaCote d'IvoireCroatiaCubaCyprusCzech RepublicDenmarkDjiboutiDominicaDominican RepublicEarly-demographic dividendEast Asia & PacificEast Asia & Pacific (excluding high income)East Asia & Pacific (IDA & IBRD countries)EcuadorEgypt, Arab Rep.El SalvadorEquatorial GuineaEritreaEstoniaEthiopiaEuro areaEurope & Central AsiaEurope & Central Asia (excluding high income)Europe & Central Asia (IDA & IBRD countries)European UnionFaroe IslandsFijiFinlandFragile and conflict affected situationsFranceFrench PolynesiaGabonGambia, TheGeorgiaGermanyGhanaGreeceGrenadaGuatemalaGuineaGuinea-BissauGuyanaHaitiHeavily indebted poor countries (HIPC)High incomeHondurasHong Kong SAR, ChinaHungaryIBRD onlyIcelandIDA & IBRD totalIDA blendIDA onlyIDA totalIndiaIndonesiaIran, Islamic Rep.IraqIrelandIsraelItalyJamaicaJapanJordanKazakhstanKenyaKiribatiKorea, Rep.KosovoKuwaitKyrgyz RepublicLao PDRLate-demographic dividendLatin America & Caribbean Latin America & Caribbean (excluding high income)Latin America & the Caribbean (IDA & IBRD countries)LatviaLeast developed countries: UN classificationLebanonLesothoLiberiaLibyaLithuaniaLow & middle incomeLow incomeLower middle incomeLuxembourgMacao SAR, ChinaMacedonia, FYRMadagascarMalawiMalaysiaMaldivesMaliMaltaMauritaniaMauritiusMexicoMicronesia, Fed. Sts.Middle East & North AfricaMiddle East & North Africa (excluding high income)Middle East & North Africa (IDA & IBRD countries)Middle incomeMoldovaMongoliaMontenegroMoroccoMozambiqueMyanmarNamibiaNepalNetherlandsNew CaledoniaNew ZealandNicaraguaNigerNigeriaNorth AmericaNorwayOECD membersOmanOther small statesPacific island small statesPakistanPalauPanamaPapua New GuineaParaguayPeruPhilippinesPolandPortugalPost-demographic dividendPre-demographic dividendPuerto RicoQatarRomaniaRussian FederationRwandaSamoaSaudi ArabiaSenegalSerbiaSeychellesSierra LeoneSingaporeSlovak RepublicSloveniaSmall statesSolomon IslandsSomaliaSouth AfricaSouth AsiaSouth Asia (IDA & IBRD)South SudanSpainSri LankaSt. Kitts and NevisSt. LuciaSt. Vincent and the GrenadinesSub-Saharan Africa Sub-Saharan Africa (excluding high income)Sub-Saharan Africa (IDA & IBRD countries)SudanSurinameSwazilandSwedenSwitzerlandSyrian Arab RepublicTajikistanTanzaniaThailandTimor-LesteTogoTongaTrinidad and TobagoTunisiaTurkeyTurkmenistanUgandaUkraineUnited Arab EmiratesUnited KingdomUnited StatesUpper middle incomeUruguayUzbekistanVanuatuVenezuela, RBVietnamWest Bank and GazaWorldYemen, Rep.ZambiaZimbabwe Timeline:
This timeline shows a graph from 1961 to 2016 of Brazil. No data until 1960. Number of actual observations by date: 56.
Source name:
World Development Indicators
Source organization:
World Bank national accounts data, and OECD National Accounts data files.
Categories, topics:
Economy & Growth, Trade
Last updated:
apr 23, 2017
Indicators value changes by year
Maximum:
29.678
jan 1, 2005
At the date of observation
Value
Absolute change
Change from previous value
jan 1, 1961
14.176
+14.176
0.0%
jan 1, 1962
14.619
+0.443
3.12%
jan 1, 1963
9.058
-5.561
-38.04%
jan 1, 1964
18.147
+9.09
100.35%
jan 1, 1965
12.063
-6.084
-33.53%
jan 1, 1966
13.292
+1.229
10.19%
jan 1, 1967
12.816
-0.475
-3.58%
jan 1, 1968
11.538
-1.278
-9.98%
jan 1, 1969
12.611
+1.073
9.3%
jan 1, 1970
13.174
+0.563
4.47%
jan 1, 1971
14.479
+1.305
9.91%
jan 1, 1972
14.551
+0.072
0.5%
jan 1, 1973
16.103
+1.552
10.67%
jan 1, 1974
17.773
+1.67
10.37%
jan 1, 1975
21.897
+4.124
23.2%
jan 1, 1976
19.044
-2.853
-13.03%
jan 1, 1977
16.468
-2.576
-13.53%
jan 1, 1978
15.17
-1.298
-7.88%
jan 1, 1979
14.54
-0.63
-4.15%
jan 1, 1980
16.299
+1.759
12.1%
jan 1, 1981
20.359
+4.059
24.9%
jan 1, 1982
19.22
-1.139
-5.59%
jan 1, 1983
15.884
-3.336
-17.36%
jan 1, 1984
20.43
+4.546
28.62%
jan 1, 1985
21.472
+1.042
5.1%
jan 1, 1986
19.343
-2.129
-9.91%
jan 1, 1987
15.171
-4.172
-21.57%
jan 1, 1988
15.653
+0.481
3.17%
jan 1, 1989
16.581
+0.928
5.93%
jan 1, 1990
14.391
-2.19
-13.21%
jan 1, 1991
15.162
+0.771
5.36%
jan 1, 1992
16.591
+1.429
9.43%
jan 1, 1993
19.253
+2.662
16.05%
jan 1, 1994
19.599
+0.346
1.8%
jan 1, 1995
19.333
-0.266
-1.36%
jan 1, 1996
16.633
-2.7
-13.97%
jan 1, 1997
15.636
-0.997
-5.99%
jan 1, 1998
16.576
+0.941
6.02%
jan 1, 1999
16.439
-0.138
-0.83%
jan 1, 2000
20.982
+4.543
27.64%
jan 1, 2001
22.64
+1.658
7.9%
jan 1, 2002
26.936
+4.297
18.98%
jan 1, 2003
27.618
+0.682
2.53%
jan 1, 2004
28.14
+0.522
1.89%
jan 1, 2005
29.678
+1.538
5.46%
jan 1, 2006
27.087
-2.591
-8.73%
jan 1, 2007
26.042
-1.045
-3.86%
jan 1, 2008
25.293
-0.749
-2.88%
jan 1, 2009
27.258
+1.965
7.77%
jan 1, 2010
22.106
-5.152
-18.9%
jan 1, 2011
22.517
+0.411
1.86%
jan 1, 2012
23.716
+1.199
5.32%
jan 1, 2013
24.811
+1.094
4.61%
jan 1, 2014
25.635
+0.824
3.32%
jan 1, 2015
25.107
-0.527
-2.06%
jan 1, 2016
27.367
+2.26
9.0%
Ranking of countries by current statistics by years


Comments: