29
/
en
AIzaSyAYiBZKx7MnpbEhh9jyipgxe19OcubqV5w
April 1, 2024
77708
Bahrain
BHR
true
2
1
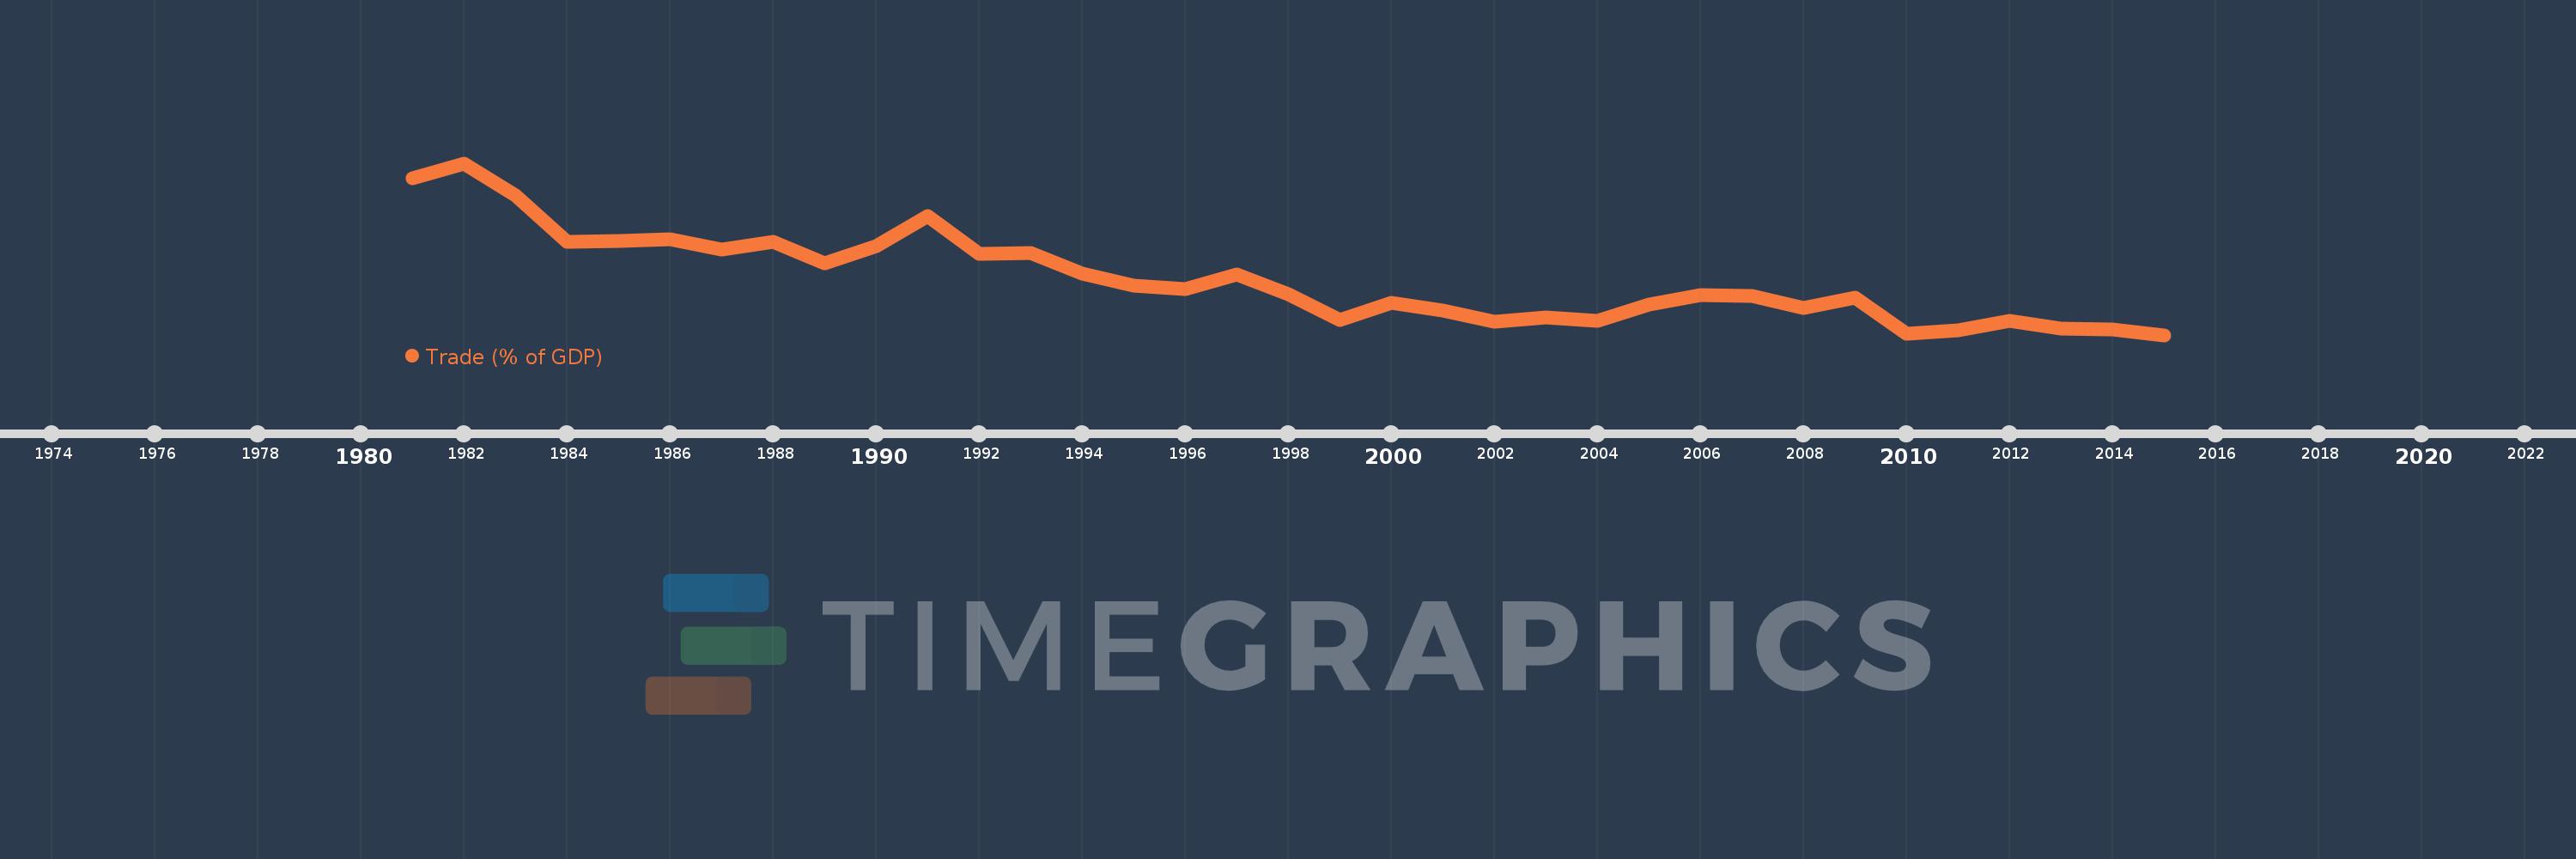
Trade (% of GDP)
2015,2014,2013,2012,2011,2010,2009,2008,2007,2006,2005,2004,2003,2002,2001,2000,1999,1998,1997,1996,1995,1994,1993,1992,1991,1990,1989,1988,1987,1986,1985,1984,1983,1982,1981
This statistics in other country:
AfghanistanAlbaniaAlgeriaAngolaAntigua and BarbudaArab WorldArgentinaArmeniaArubaAustraliaAustriaAzerbaijanBahamas, TheBahrainBangladeshBarbadosBelarusBelgiumBelizeBeninBermudaBhutanBoliviaBosnia and HerzegovinaBotswanaBrazilBrunei DarussalamBulgariaBurkina FasoBurundiCabo VerdeCambodiaCameroonCanadaCaribbean small statesCentral African RepublicCentral Europe and the BalticsChadChileChinaColombiaComorosCongo, Dem. Rep.Congo, Rep.Costa RicaCote d'IvoireCroatiaCubaCyprusCzech RepublicDenmarkDjiboutiDominicaDominican RepublicEarly-demographic dividendEast Asia & PacificEast Asia & Pacific (excluding high income)East Asia & Pacific (IDA & IBRD countries)EcuadorEgypt, Arab Rep.El SalvadorEquatorial GuineaEritreaEstoniaEthiopiaEuro areaEurope & Central AsiaEurope & Central Asia (excluding high income)Europe & Central Asia (IDA & IBRD countries)European UnionFaroe IslandsFijiFinlandFragile and conflict affected situationsFranceFrench PolynesiaGabonGambia, TheGeorgiaGermanyGhanaGreeceGrenadaGuatemalaGuineaGuinea-BissauGuyanaHaitiHeavily indebted poor countries (HIPC)High incomeHondurasHong Kong SAR, ChinaHungaryIBRD onlyIcelandIDA & IBRD totalIDA blendIDA onlyIDA totalIndiaIndonesiaIran, Islamic Rep.IraqIrelandIsraelItalyJamaicaJapanJordanKazakhstanKenyaKiribatiKorea, Rep.KosovoKuwaitKyrgyz RepublicLao PDRLate-demographic dividendLatin America & Caribbean Latin America & Caribbean (excluding high income)Latin America & the Caribbean (IDA & IBRD countries)LatviaLeast developed countries: UN classificationLebanonLesothoLiberiaLibyaLithuaniaLow & middle incomeLow incomeLower middle incomeLuxembourgMacao SAR, ChinaMacedonia, FYRMadagascarMalawiMalaysiaMaldivesMaliMaltaMauritaniaMauritiusMexicoMicronesia, Fed. Sts.Middle East & North AfricaMiddle East & North Africa (excluding high income)Middle East & North Africa (IDA & IBRD countries)Middle incomeMoldovaMongoliaMontenegroMoroccoMozambiqueMyanmarNamibiaNepalNetherlandsNew CaledoniaNew ZealandNicaraguaNigerNigeriaNorth AmericaNorwayOECD membersOmanOther small statesPacific island small statesPakistanPalauPanamaPapua New GuineaParaguayPeruPhilippinesPolandPortugalPost-demographic dividendPre-demographic dividendPuerto RicoQatarRomaniaRussian FederationRwandaSamoaSaudi ArabiaSenegalSerbiaSeychellesSierra LeoneSingaporeSlovak RepublicSloveniaSmall statesSolomon IslandsSomaliaSouth AfricaSouth AsiaSouth Asia (IDA & IBRD)South SudanSpainSri LankaSt. Kitts and NevisSt. LuciaSt. Vincent and the GrenadinesSub-Saharan Africa Sub-Saharan Africa (excluding high income)Sub-Saharan Africa (IDA & IBRD countries)SudanSurinameSwazilandSwedenSwitzerlandSyrian Arab RepublicTajikistanTanzaniaThailandTimor-LesteTogoTongaTrinidad and TobagoTunisiaTurkeyTurkmenistanUgandaUkraineUnited Arab EmiratesUnited KingdomUnited StatesUpper middle incomeUruguayUzbekistanVanuatuVenezuela, RBVietnamWest Bank and GazaWorldYemen, Rep.ZambiaZimbabwe Timeline:
This timeline shows a graph from 1981 to 2015 of Bahrain. No data until 1980. Number of actual observations by date: 35.
Source name:
World Development Indicators
Source organization:
World Bank national accounts data, and OECD National Accounts data files.
Categories, topics:
Economy & Growth, Trade
Last updated:
apr 23, 2017
Indicators value changes by year
Minimum:
116.884
jan 1, 2015
Maximum:
251.139
jan 1, 1982
At the date of observation
Value
Absolute change
Change from previous value
jan 1, 1981
239.349
+239.349
0.0%
jan 1, 1982
251.139
+11.79
4.93%
jan 1, 1983
225.759
-25.38
-10.11%
jan 1, 1984
189.633
-36.126
-16.0%
jan 1, 1985
190.33
+0.698
0.37%
jan 1, 1986
191.61
+1.28
0.67%
jan 1, 1987
183.524
-8.087
-4.22%
jan 1, 1988
189.768
+6.244
3.4%
jan 1, 1989
172.832
-16.936
-8.92%
jan 1, 1990
186.274
+13.441
7.78%
jan 1, 1991
210.161
+23.887
12.82%
jan 1, 1992
180.642
-29.519
-14.05%
jan 1, 1993
181.124
+0.482
0.27%
jan 1, 1994
164.604
-16.52
-9.12%
jan 1, 1995
155.178
-9.426
-5.73%
jan 1, 1996
152.464
-2.714
-1.75%
jan 1, 1997
164.115
+11.651
7.64%
jan 1, 1998
148.582
-15.533
-9.46%
jan 1, 1999
128.489
-20.093
-13.52%
jan 1, 2000
141.832
+13.343
10.38%
jan 1, 2001
135.809
-6.023
-4.25%
jan 1, 2002
127.026
-8.783
-6.47%
jan 1, 2003
130.608
+3.581
2.82%
jan 1, 2004
128.091
-2.516
-1.93%
jan 1, 2005
140.737
+12.646
9.87%
jan 1, 2006
148.313
+7.576
5.38%
jan 1, 2007
147.102
-1.212
-0.82%
jan 1, 2008
137.785
-9.317
-6.33%
jan 1, 2009
145.883
+8.098
5.88%
jan 1, 2010
117.964
-27.919
-19.14%
jan 1, 2011
120.472
+2.509
2.13%
jan 1, 2012
127.985
+7.513
6.24%
jan 1, 2013
122.19
-5.795
-4.53%
jan 1, 2014
121.222
-0.968
-0.79%
jan 1, 2015
116.884
-4.338
-3.58%
Ranking of countries by current statistics by years


Comments: