29
/
en
AIzaSyAYiBZKx7MnpbEhh9jyipgxe19OcubqV5w
April 1, 2024
59423
Sub-Saharan Africa
SSF
false
2
1
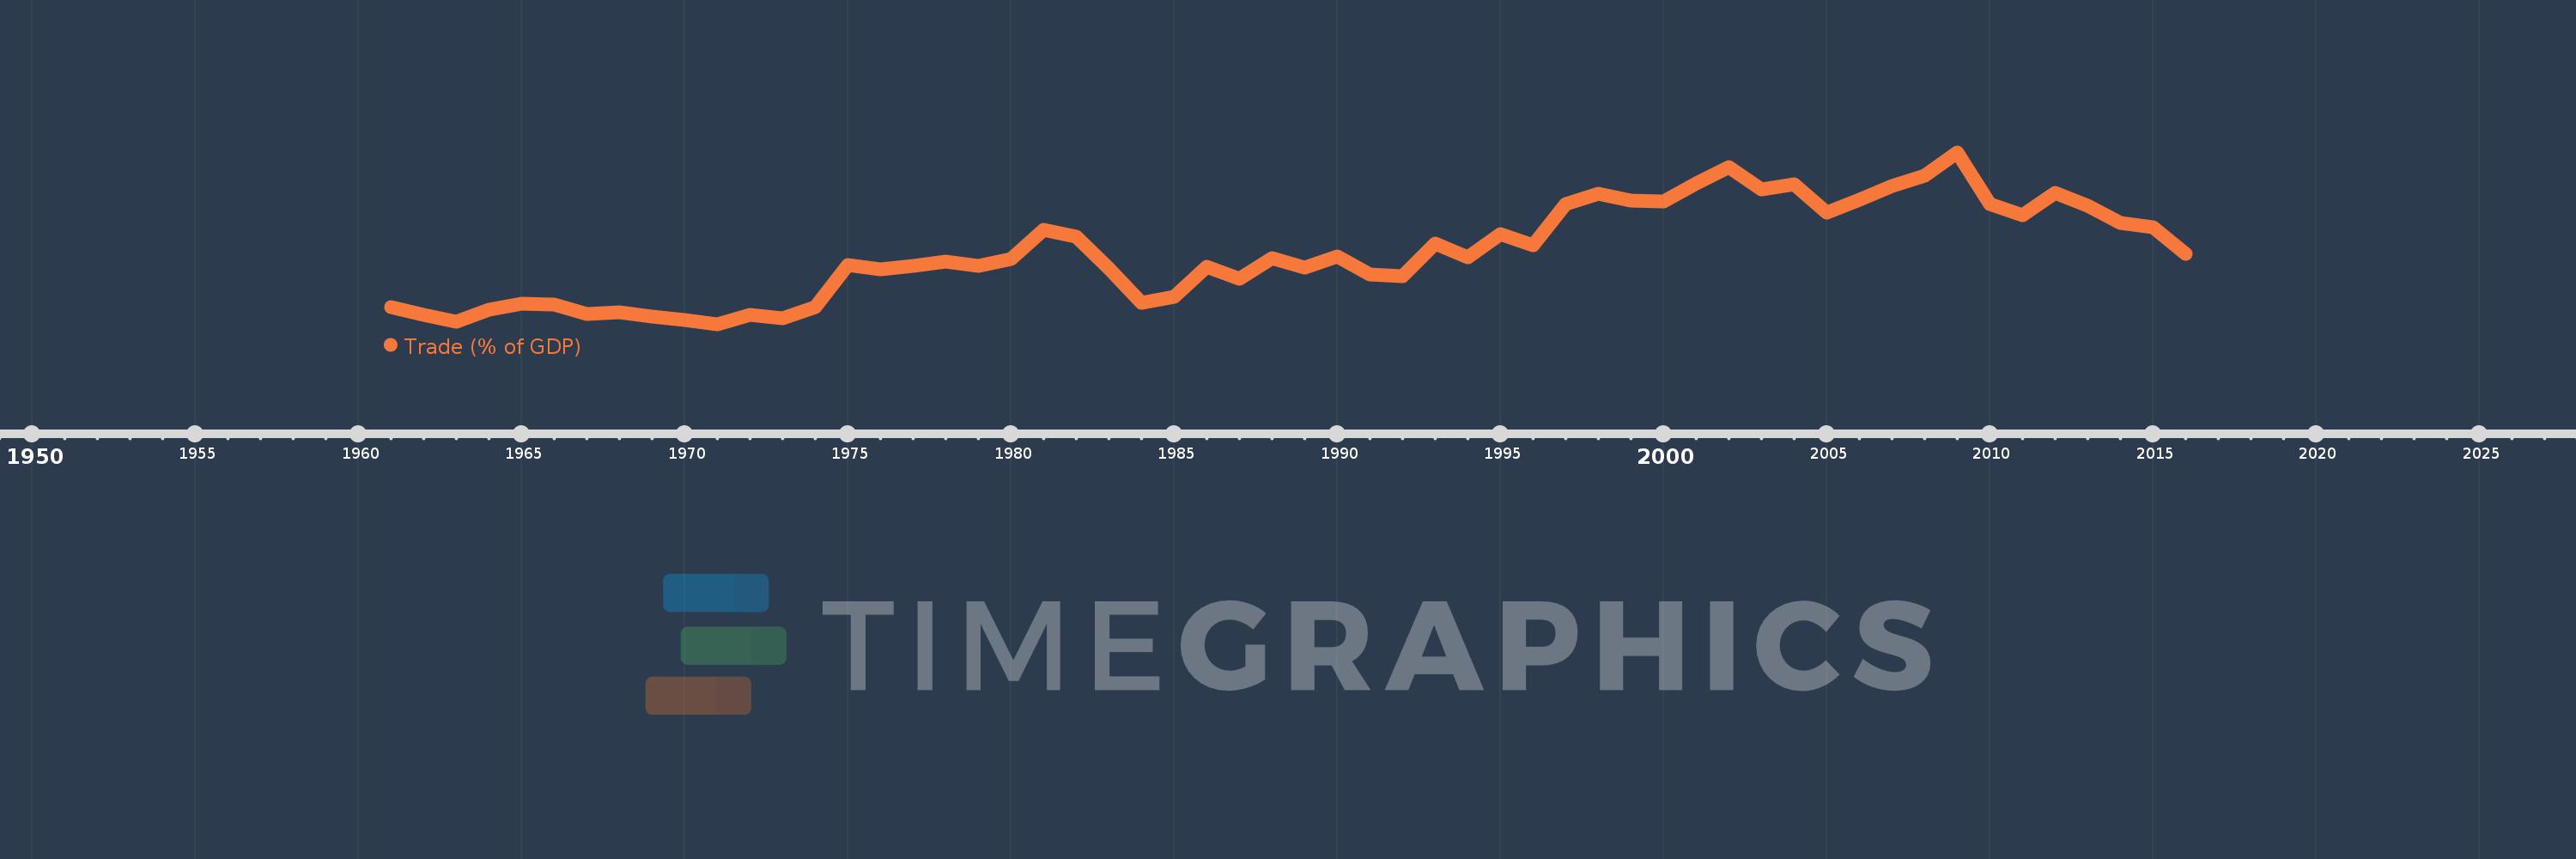
Trade (% of GDP)
2016,2015,2014,2013,2012,2011,2010,2009,2008,2007,2006,2005,2004,2003,2002,2001,2000,1999,1998,1997,1996,1995,1994,1993,1992,1991,1990,1989,1988,1987,1986,1985,1984,1983,1982,1981,1980,1979,1978,1977,1976,1975,1974,1973,1972,1971,1970,1969,1968,1967,1966,1965,1964,1963,1962,1961
This statistics in other country:
AfghanistanAlbaniaAlgeriaAngolaAntigua and BarbudaArab WorldArgentinaArmeniaArubaAustraliaAustriaAzerbaijanBahamas, TheBahrainBangladeshBarbadosBelarusBelgiumBelizeBeninBermudaBhutanBoliviaBosnia and HerzegovinaBotswanaBrazilBrunei DarussalamBulgariaBurkina FasoBurundiCabo VerdeCambodiaCameroonCanadaCaribbean small statesCentral African RepublicCentral Europe and the BalticsChadChileChinaColombiaComorosCongo, Dem. Rep.Congo, Rep.Costa RicaCote d'IvoireCroatiaCubaCyprusCzech RepublicDenmarkDjiboutiDominicaDominican RepublicEarly-demographic dividendEast Asia & PacificEast Asia & Pacific (excluding high income)East Asia & Pacific (IDA & IBRD countries)EcuadorEgypt, Arab Rep.El SalvadorEquatorial GuineaEritreaEstoniaEthiopiaEuro areaEurope & Central AsiaEurope & Central Asia (excluding high income)Europe & Central Asia (IDA & IBRD countries)European UnionFaroe IslandsFijiFinlandFragile and conflict affected situationsFranceFrench PolynesiaGabonGambia, TheGeorgiaGermanyGhanaGreeceGrenadaGuatemalaGuineaGuinea-BissauGuyanaHaitiHeavily indebted poor countries (HIPC)High incomeHondurasHong Kong SAR, ChinaHungaryIBRD onlyIcelandIDA & IBRD totalIDA blendIDA onlyIDA totalIndiaIndonesiaIran, Islamic Rep.IraqIrelandIsraelItalyJamaicaJapanJordanKazakhstanKenyaKiribatiKorea, Rep.KosovoKuwaitKyrgyz RepublicLao PDRLate-demographic dividendLatin America & Caribbean Latin America & Caribbean (excluding high income)Latin America & the Caribbean (IDA & IBRD countries)LatviaLeast developed countries: UN classificationLebanonLesothoLiberiaLibyaLithuaniaLow & middle incomeLow incomeLower middle incomeLuxembourgMacao SAR, ChinaMacedonia, FYRMadagascarMalawiMalaysiaMaldivesMaliMaltaMauritaniaMauritiusMexicoMicronesia, Fed. Sts.Middle East & North AfricaMiddle East & North Africa (excluding high income)Middle East & North Africa (IDA & IBRD countries)Middle incomeMoldovaMongoliaMontenegroMoroccoMozambiqueMyanmarNamibiaNepalNetherlandsNew CaledoniaNew ZealandNicaraguaNigerNigeriaNorth AmericaNorwayOECD membersOmanOther small statesPacific island small statesPakistanPalauPanamaPapua New GuineaParaguayPeruPhilippinesPolandPortugalPost-demographic dividendPre-demographic dividendPuerto RicoQatarRomaniaRussian FederationRwandaSamoaSaudi ArabiaSenegalSerbiaSeychellesSierra LeoneSingaporeSlovak RepublicSloveniaSmall statesSolomon IslandsSomaliaSouth AfricaSouth AsiaSouth Asia (IDA & IBRD)South SudanSpainSri LankaSt. Kitts and NevisSt. LuciaSt. Vincent and the GrenadinesSub-Saharan Africa Sub-Saharan Africa (excluding high income)Sub-Saharan Africa (IDA & IBRD countries)SudanSurinameSwazilandSwedenSwitzerlandSyrian Arab RepublicTajikistanTanzaniaThailandTimor-LesteTogoTongaTrinidad and TobagoTunisiaTurkeyTurkmenistanUgandaUkraineUnited Arab EmiratesUnited KingdomUnited StatesUpper middle incomeUruguayUzbekistanVanuatuVenezuela, RBVietnamWest Bank and GazaWorldYemen, Rep.ZambiaZimbabwe Timeline:
This timeline shows a graph from 1961 to 2016 of Sub-Saharan Africa . No data until 1960. Number of actual observations by date: 56.
Source name:
World Development Indicators
Source organization:
World Bank national accounts data, and OECD National Accounts data files.
Categories, topics:
Economy & Growth, Trade
Last updated:
apr 23, 2017
Indicators value changes by year
At the date of observation
Value
Absolute change
Change from previous value
jan 1, 1961
44.786
+44.786
0.0%
jan 1, 1962
43.227
-1.559
-3.48%
jan 1, 1963
41.934
-1.293
-2.99%
jan 1, 1964
44.313
+2.379
5.67%
jan 1, 1965
45.477
+1.164
2.63%
jan 1, 1966
45.299
-0.177
-0.39%
jan 1, 1967
43.466
-1.833
-4.05%
jan 1, 1968
43.79
+0.324
0.75%
jan 1, 1969
42.958
-0.832
-1.9%
jan 1, 1970
42.24
-0.718
-1.67%
jan 1, 1971
41.48
-0.76
-1.8%
jan 1, 1972
43.3
+1.82
4.39%
jan 1, 1973
42.685
-0.615
-1.42%
jan 1, 1974
44.772
+2.087
4.89%
jan 1, 1975
52.869
+8.097
18.08%
jan 1, 1976
52.023
-0.846
-1.6%
jan 1, 1977
52.616
+0.593
1.14%
jan 1, 1978
53.401
+0.786
1.49%
jan 1, 1979
52.593
-0.808
-1.51%
jan 1, 1980
53.947
+1.354
2.58%
jan 1, 1981
59.581
+5.633
10.44%
jan 1, 1982
58.275
-1.305
-2.19%
jan 1, 1983
52.161
-6.114
-10.49%
jan 1, 1984
45.631
-6.531
-12.52%
jan 1, 1985
46.763
+1.132
2.48%
jan 1, 1986
52.432
+5.67
12.12%
jan 1, 1987
50.187
-2.246
-4.28%
jan 1, 1988
54.133
+3.946
7.86%
jan 1, 1989
52.279
-1.853
-3.42%
jan 1, 1990
54.479
+2.199
4.21%
jan 1, 1991
50.918
-3.56
-6.54%
jan 1, 1992
50.699
-0.22
-0.43%
jan 1, 1993
56.835
+6.136
12.1%
jan 1, 1994
54.312
-2.523
-4.44%
jan 1, 1995
58.69
+4.378
8.06%
jan 1, 1996
56.608
-2.082
-3.55%
jan 1, 1997
64.505
+7.897
13.95%
jan 1, 1998
66.495
+1.991
3.09%
jan 1, 1999
65.028
-1.468
-2.21%
jan 1, 2000
64.925
-0.103
-0.16%
jan 1, 2001
68.457
+3.532
5.44%
jan 1, 2002
71.571
+3.114
4.55%
jan 1, 2003
67.235
-4.336
-6.06%
jan 1, 2004
68.21
+0.976
1.45%
jan 1, 2005
62.851
-5.359
-7.86%
jan 1, 2006
65.248
+2.397
3.81%
jan 1, 2007
67.863
+2.615
4.01%
jan 1, 2008
69.829
+1.966
2.9%
jan 1, 2009
74.31
+4.482
6.42%
jan 1, 2010
64.459
-9.852
-13.26%
jan 1, 2011
62.267
-2.192
-3.4%
jan 1, 2012
66.651
+4.384
7.04%
jan 1, 2013
64.111
-2.541
-3.81%
jan 1, 2014
60.803
-3.307
-5.16%
jan 1, 2015
59.942
-0.861
-1.42%
jan 1, 2016
54.947
-4.996
-8.33%
Ranking of countries by current statistics by years


Comments: