29
/
en
AIzaSyAYiBZKx7MnpbEhh9jyipgxe19OcubqV5w
April 1, 2024
74479
Austria
AUT
true
2
1
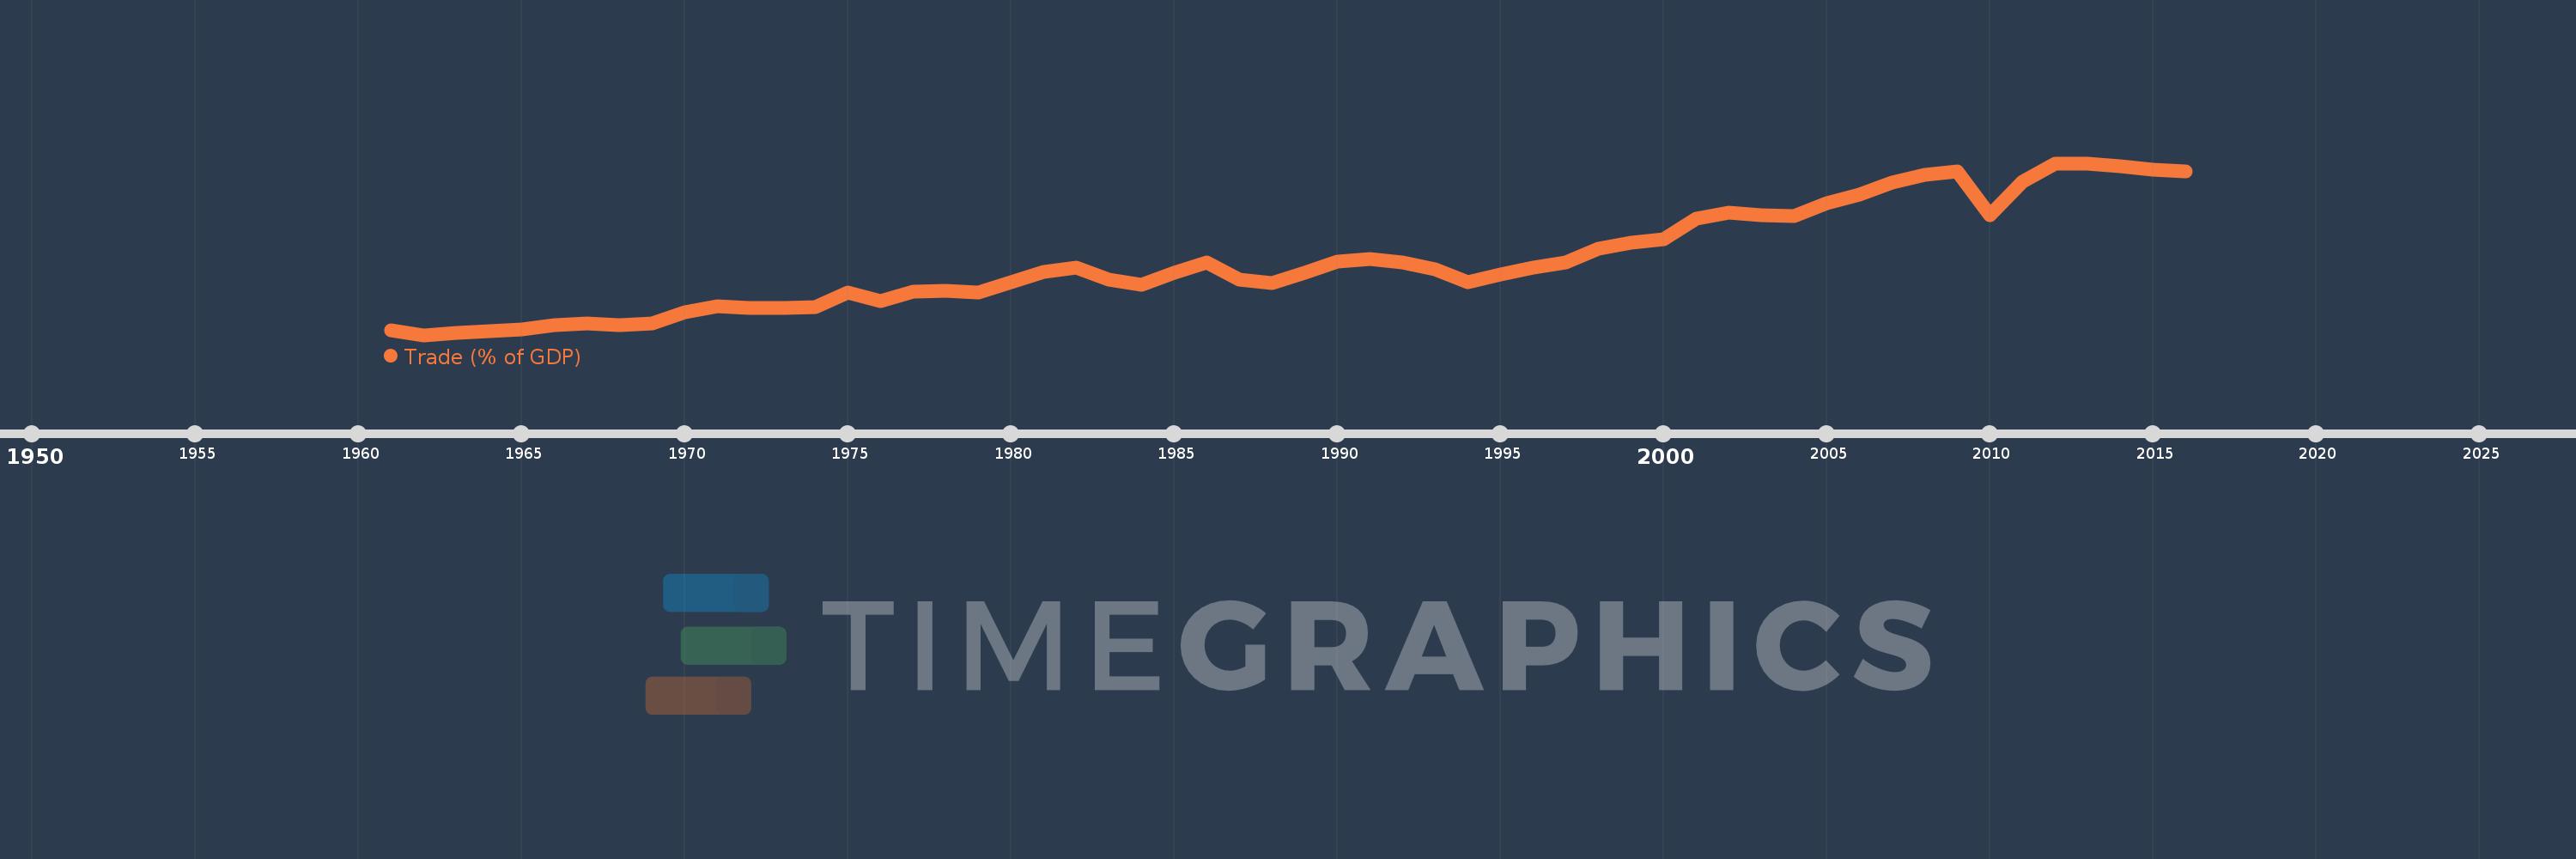
Trade (% of GDP)
2016,2015,2014,2013,2012,2011,2010,2009,2008,2007,2006,2005,2004,2003,2002,2001,2000,1999,1998,1997,1996,1995,1994,1993,1992,1991,1990,1989,1988,1987,1986,1985,1984,1983,1982,1981,1980,1979,1978,1977,1976,1975,1974,1973,1972,1971,1970,1969,1968,1967,1966,1965,1964,1963,1962,1961
This statistics in other country:
AfghanistanAlbaniaAlgeriaAngolaAntigua and BarbudaArab WorldArgentinaArmeniaArubaAustraliaAustriaAzerbaijanBahamas, TheBahrainBangladeshBarbadosBelarusBelgiumBelizeBeninBermudaBhutanBoliviaBosnia and HerzegovinaBotswanaBrazilBrunei DarussalamBulgariaBurkina FasoBurundiCabo VerdeCambodiaCameroonCanadaCaribbean small statesCentral African RepublicCentral Europe and the BalticsChadChileChinaColombiaComorosCongo, Dem. Rep.Congo, Rep.Costa RicaCote d'IvoireCroatiaCubaCyprusCzech RepublicDenmarkDjiboutiDominicaDominican RepublicEarly-demographic dividendEast Asia & PacificEast Asia & Pacific (excluding high income)East Asia & Pacific (IDA & IBRD countries)EcuadorEgypt, Arab Rep.El SalvadorEquatorial GuineaEritreaEstoniaEthiopiaEuro areaEurope & Central AsiaEurope & Central Asia (excluding high income)Europe & Central Asia (IDA & IBRD countries)European UnionFaroe IslandsFijiFinlandFragile and conflict affected situationsFranceFrench PolynesiaGabonGambia, TheGeorgiaGermanyGhanaGreeceGrenadaGuatemalaGuineaGuinea-BissauGuyanaHaitiHeavily indebted poor countries (HIPC)High incomeHondurasHong Kong SAR, ChinaHungaryIBRD onlyIcelandIDA & IBRD totalIDA blendIDA onlyIDA totalIndiaIndonesiaIran, Islamic Rep.IraqIrelandIsraelItalyJamaicaJapanJordanKazakhstanKenyaKiribatiKorea, Rep.KosovoKuwaitKyrgyz RepublicLao PDRLate-demographic dividendLatin America & Caribbean Latin America & Caribbean (excluding high income)Latin America & the Caribbean (IDA & IBRD countries)LatviaLeast developed countries: UN classificationLebanonLesothoLiberiaLibyaLithuaniaLow & middle incomeLow incomeLower middle incomeLuxembourgMacao SAR, ChinaMacedonia, FYRMadagascarMalawiMalaysiaMaldivesMaliMaltaMauritaniaMauritiusMexicoMicronesia, Fed. Sts.Middle East & North AfricaMiddle East & North Africa (excluding high income)Middle East & North Africa (IDA & IBRD countries)Middle incomeMoldovaMongoliaMontenegroMoroccoMozambiqueMyanmarNamibiaNepalNetherlandsNew CaledoniaNew ZealandNicaraguaNigerNigeriaNorth AmericaNorwayOECD membersOmanOther small statesPacific island small statesPakistanPalauPanamaPapua New GuineaParaguayPeruPhilippinesPolandPortugalPost-demographic dividendPre-demographic dividendPuerto RicoQatarRomaniaRussian FederationRwandaSamoaSaudi ArabiaSenegalSerbiaSeychellesSierra LeoneSingaporeSlovak RepublicSloveniaSmall statesSolomon IslandsSomaliaSouth AfricaSouth AsiaSouth Asia (IDA & IBRD)South SudanSpainSri LankaSt. Kitts and NevisSt. LuciaSt. Vincent and the GrenadinesSub-Saharan Africa Sub-Saharan Africa (excluding high income)Sub-Saharan Africa (IDA & IBRD countries)SudanSurinameSwazilandSwedenSwitzerlandSyrian Arab RepublicTajikistanTanzaniaThailandTimor-LesteTogoTongaTrinidad and TobagoTunisiaTurkeyTurkmenistanUgandaUkraineUnited Arab EmiratesUnited KingdomUnited StatesUpper middle incomeUruguayUzbekistanVanuatuVenezuela, RBVietnamWest Bank and GazaWorldYemen, Rep.ZambiaZimbabwe Timeline:
This timeline shows a graph from 1961 to 2016 of Austria. No data until 1960. Number of actual observations by date: 56.
Source name:
World Development Indicators
Source organization:
World Bank national accounts data, and OECD National Accounts data files.
Categories, topics:
Economy & Growth, Trade
Last updated:
apr 23, 2017
Indicators value changes by year
Minimum:
44.907
jan 1, 1962
At the date of observation
Value
Absolute change
Change from previous value
jan 1, 1961
46.51
+46.51
0.0%
jan 1, 1962
44.907
-1.603
-3.45%
jan 1, 1963
45.618
+0.711
1.58%
jan 1, 1964
46.285
+0.667
1.46%
jan 1, 1965
46.986
+0.701
1.51%
jan 1, 1966
48.239
+1.254
2.67%
jan 1, 1967
48.926
+0.686
1.42%
jan 1, 1968
48.309
-0.617
-1.26%
jan 1, 1969
49.014
+0.705
1.46%
jan 1, 1970
52.725
+3.711
7.57%
jan 1, 1971
54.97
+2.244
4.26%
jan 1, 1972
54.489
-0.481
-0.87%
jan 1, 1973
54.404
-0.085
-0.16%
jan 1, 1974
54.565
+0.161
0.3%
jan 1, 1975
59.686
+5.121
9.38%
jan 1, 1976
56.712
-2.974
-4.98%
jan 1, 1977
60.035
+3.323
5.86%
jan 1, 1978
60.396
+0.361
0.6%
jan 1, 1979
59.786
-0.61
-1.01%
jan 1, 1980
63.443
+3.656
6.12%
jan 1, 1981
66.957
+3.514
5.54%
jan 1, 1982
68.532
+1.575
2.35%
jan 1, 1983
64.245
-4.287
-6.26%
jan 1, 1984
62.596
-1.649
-2.57%
jan 1, 1985
66.707
+4.111
6.57%
jan 1, 1986
70.223
+3.515
5.27%
jan 1, 1987
64.142
-6.081
-8.66%
jan 1, 1988
62.979
-1.163
-1.81%
jan 1, 1989
66.695
+3.716
5.9%
jan 1, 1990
70.679
+3.984
5.97%
jan 1, 1991
71.631
+0.952
1.35%
jan 1, 1992
70.188
-1.443
-2.01%
jan 1, 1993
67.764
-2.423
-3.45%
jan 1, 1994
63.391
-4.373
-6.45%
jan 1, 1995
66.118
+2.727
4.3%
jan 1, 1996
68.392
+2.274
3.44%
jan 1, 1997
70.207
+1.815
2.65%
jan 1, 1998
74.993
+4.786
6.82%
jan 1, 1999
77.088
+2.095
2.79%
jan 1, 2000
78.379
+1.291
1.68%
jan 1, 2001
85.474
+7.095
9.05%
jan 1, 2002
87.639
+2.165
2.53%
jan 1, 2003
86.96
-0.679
-0.77%
jan 1, 2004
86.492
-0.468
-0.54%
jan 1, 2005
90.934
+4.442
5.14%
jan 1, 2006
94.162
+3.228
3.55%
jan 1, 2007
98.23
+4.068
4.32%
jan 1, 2008
100.819
+2.589
2.64%
jan 1, 2009
102.125
+1.306
1.3%
jan 1, 2010
86.807
-15.318
-15.0%
jan 1, 2011
98.683
+11.876
13.68%
jan 1, 2012
104.824
+6.141
6.22%
jan 1, 2013
105.0
+0.176
0.17%
jan 1, 2014
103.803
-1.197
-1.14%
jan 1, 2015
102.732
-1.071
-1.03%
jan 1, 2016
102.112
-0.62
-0.6%
Ranking of countries by current statistics by years


Comments: