29
/
en
AIzaSyAYiBZKx7MnpbEhh9jyipgxe19OcubqV5w
April 1, 2024
145198
Guatemala
GTM
true
2
1
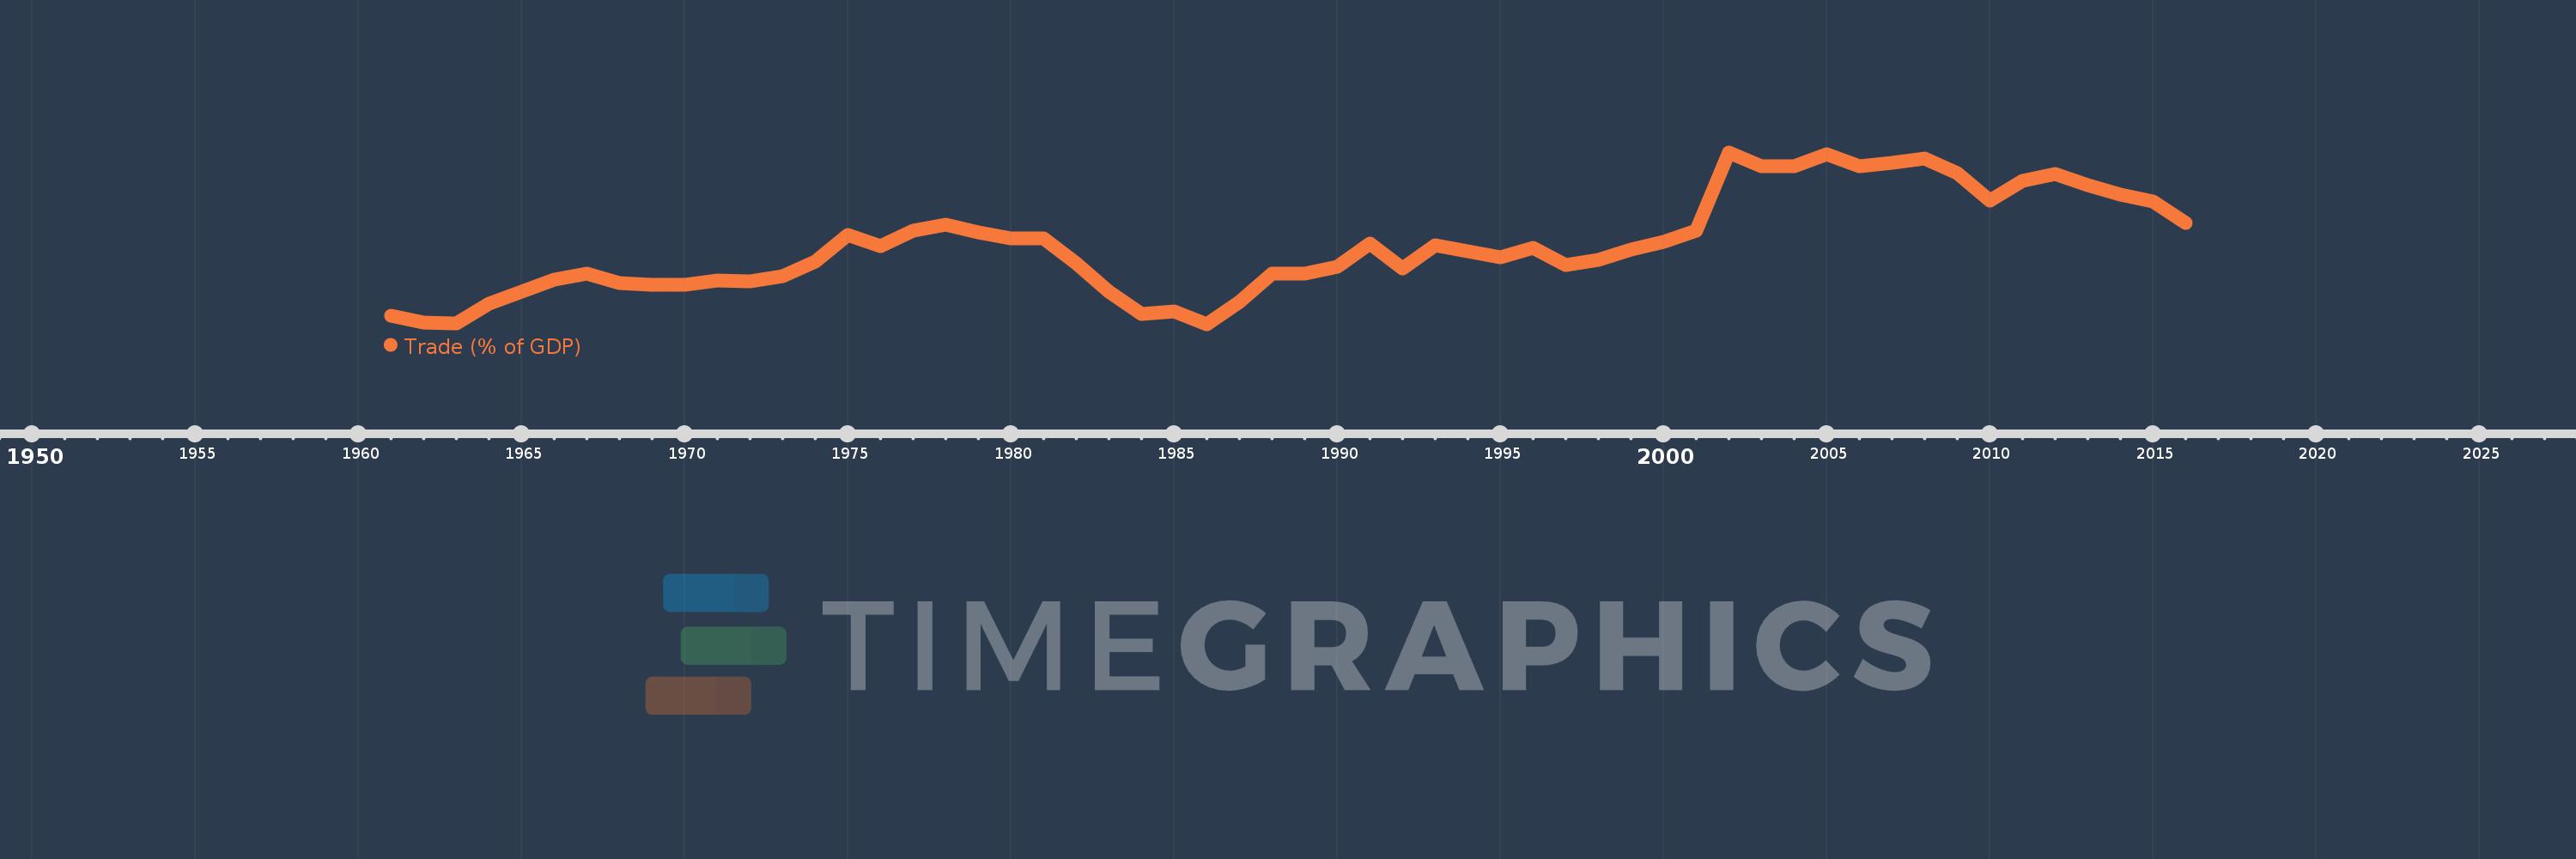
Trade (% of GDP)
2016,2015,2014,2013,2012,2011,2010,2009,2008,2007,2006,2005,2004,2003,2002,2001,2000,1999,1998,1997,1996,1995,1994,1993,1992,1991,1990,1989,1988,1987,1986,1985,1984,1983,1982,1981,1980,1979,1978,1977,1976,1975,1974,1973,1972,1971,1970,1969,1968,1967,1966,1965,1964,1963,1962,1961
This statistics in other country:
AfghanistanAlbaniaAlgeriaAngolaAntigua and BarbudaArab WorldArgentinaArmeniaArubaAustraliaAustriaAzerbaijanBahamas, TheBahrainBangladeshBarbadosBelarusBelgiumBelizeBeninBermudaBhutanBoliviaBosnia and HerzegovinaBotswanaBrazilBrunei DarussalamBulgariaBurkina FasoBurundiCabo VerdeCambodiaCameroonCanadaCaribbean small statesCentral African RepublicCentral Europe and the BalticsChadChileChinaColombiaComorosCongo, Dem. Rep.Congo, Rep.Costa RicaCote d'IvoireCroatiaCubaCyprusCzech RepublicDenmarkDjiboutiDominicaDominican RepublicEarly-demographic dividendEast Asia & PacificEast Asia & Pacific (excluding high income)East Asia & Pacific (IDA & IBRD countries)EcuadorEgypt, Arab Rep.El SalvadorEquatorial GuineaEritreaEstoniaEthiopiaEuro areaEurope & Central AsiaEurope & Central Asia (excluding high income)Europe & Central Asia (IDA & IBRD countries)European UnionFaroe IslandsFijiFinlandFragile and conflict affected situationsFranceFrench PolynesiaGabonGambia, TheGeorgiaGermanyGhanaGreeceGrenadaGuatemalaGuineaGuinea-BissauGuyanaHaitiHeavily indebted poor countries (HIPC)High incomeHondurasHong Kong SAR, ChinaHungaryIBRD onlyIcelandIDA & IBRD totalIDA blendIDA onlyIDA totalIndiaIndonesiaIran, Islamic Rep.IraqIrelandIsraelItalyJamaicaJapanJordanKazakhstanKenyaKiribatiKorea, Rep.KosovoKuwaitKyrgyz RepublicLao PDRLate-demographic dividendLatin America & Caribbean Latin America & Caribbean (excluding high income)Latin America & the Caribbean (IDA & IBRD countries)LatviaLeast developed countries: UN classificationLebanonLesothoLiberiaLibyaLithuaniaLow & middle incomeLow incomeLower middle incomeLuxembourgMacao SAR, ChinaMacedonia, FYRMadagascarMalawiMalaysiaMaldivesMaliMaltaMauritaniaMauritiusMexicoMicronesia, Fed. Sts.Middle East & North AfricaMiddle East & North Africa (excluding high income)Middle East & North Africa (IDA & IBRD countries)Middle incomeMoldovaMongoliaMontenegroMoroccoMozambiqueMyanmarNamibiaNepalNetherlandsNew CaledoniaNew ZealandNicaraguaNigerNigeriaNorth AmericaNorwayOECD membersOmanOther small statesPacific island small statesPakistanPalauPanamaPapua New GuineaParaguayPeruPhilippinesPolandPortugalPost-demographic dividendPre-demographic dividendPuerto RicoQatarRomaniaRussian FederationRwandaSamoaSaudi ArabiaSenegalSerbiaSeychellesSierra LeoneSingaporeSlovak RepublicSloveniaSmall statesSolomon IslandsSomaliaSouth AfricaSouth AsiaSouth Asia (IDA & IBRD)South SudanSpainSri LankaSt. Kitts and NevisSt. LuciaSt. Vincent and the GrenadinesSub-Saharan Africa Sub-Saharan Africa (excluding high income)Sub-Saharan Africa (IDA & IBRD countries)SudanSurinameSwazilandSwedenSwitzerlandSyrian Arab RepublicTajikistanTanzaniaThailandTimor-LesteTogoTongaTrinidad and TobagoTunisiaTurkeyTurkmenistanUgandaUkraineUnited Arab EmiratesUnited KingdomUnited StatesUpper middle incomeUruguayUzbekistanVanuatuVenezuela, RBVietnamWest Bank and GazaWorldYemen, Rep.ZambiaZimbabwe Timeline:
This timeline shows a graph from 1961 to 2016 of Guatemala. No data until 1960. Number of actual observations by date: 56.
Source name:
World Development Indicators
Source organization:
World Bank national accounts data, and OECD National Accounts data files.
Categories, topics:
Economy & Growth, Trade
Last updated:
apr 23, 2017
Indicators value changes by year
Minimum:
24.932
jan 1, 1986
Maximum:
69.545
jan 1, 2002
At the date of observation
Value
Absolute change
Change from previous value
jan 1, 1961
27.175
+27.175
0.0%
jan 1, 1962
25.448
-1.727
-6.36%
jan 1, 1963
25.21
-0.238
-0.94%
jan 1, 1964
30.219
+5.009
19.87%
jan 1, 1965
33.477
+3.258
10.78%
jan 1, 1966
36.398
+2.921
8.72%
jan 1, 1967
38.074
+1.677
4.61%
jan 1, 1968
35.721
-2.354
-6.18%
jan 1, 1969
35.151
-0.57
-1.6%
jan 1, 1970
35.234
+0.083
0.24%
jan 1, 1971
36.35
+1.116
3.17%
jan 1, 1972
35.983
-0.366
-1.01%
jan 1, 1973
37.443
+1.46
4.06%
jan 1, 1974
41.087
+3.643
9.73%
jan 1, 1975
48.072
+6.985
17.0%
jan 1, 1976
45.256
-2.816
-5.86%
jan 1, 1977
49.156
+3.9
8.62%
jan 1, 1978
50.713
+1.557
3.17%
jan 1, 1979
48.738
-1.974
-3.89%
jan 1, 1980
47.2
-1.539
-3.16%
jan 1, 1981
47.105
-0.094
-0.2%
jan 1, 1982
40.691
-6.414
-13.62%
jan 1, 1983
33.475
-7.216
-17.73%
jan 1, 1984
27.547
-5.928
-17.71%
jan 1, 1985
28.153
+0.606
2.2%
jan 1, 1986
24.932
-3.221
-11.44%
jan 1, 1987
30.644
+5.712
22.91%
jan 1, 1988
38.143
+7.499
24.47%
jan 1, 1989
38.04
-0.103
-0.27%
jan 1, 1990
39.782
+1.742
4.58%
jan 1, 1991
45.869
+6.088
15.3%
jan 1, 1992
39.52
-6.349
-13.84%
jan 1, 1993
45.362
+5.842
14.78%
jan 1, 1994
43.779
-1.583
-3.49%
jan 1, 1995
42.371
-1.408
-3.22%
jan 1, 1996
44.689
+2.319
5.47%
jan 1, 1997
40.393
-4.296
-9.61%
jan 1, 1998
41.552
+1.159
2.87%
jan 1, 1999
44.424
+2.872
6.91%
jan 1, 2000
46.361
+1.937
4.36%
jan 1, 2001
49.146
+2.785
6.01%
jan 1, 2002
69.545
+20.399
41.51%
jan 1, 2003
66.032
-3.513
-5.05%
jan 1, 2004
65.96
-0.072
-0.11%
jan 1, 2005
69.078
+3.118
4.73%
jan 1, 2006
66.049
-3.029
-4.39%
jan 1, 2007
66.818
+0.77
1.17%
jan 1, 2008
67.898
+1.08
1.62%
jan 1, 2009
64.125
-3.773
-5.56%
jan 1, 2010
57.106
-7.019
-10.95%
jan 1, 2011
62.115
+5.009
8.77%
jan 1, 2012
63.984
+1.869
3.01%
jan 1, 2013
60.982
-3.002
-4.69%
jan 1, 2014
58.548
-2.434
-3.99%
jan 1, 2015
56.718
-1.83
-3.13%
jan 1, 2016
51.333
-5.385
-9.49%
Ranking of countries by current statistics by years


Comments: