29
/
en
AIzaSyAYiBZKx7MnpbEhh9jyipgxe19OcubqV5w
April 1, 2024
147524
Guinea-Bissau
GNB
true
2
1
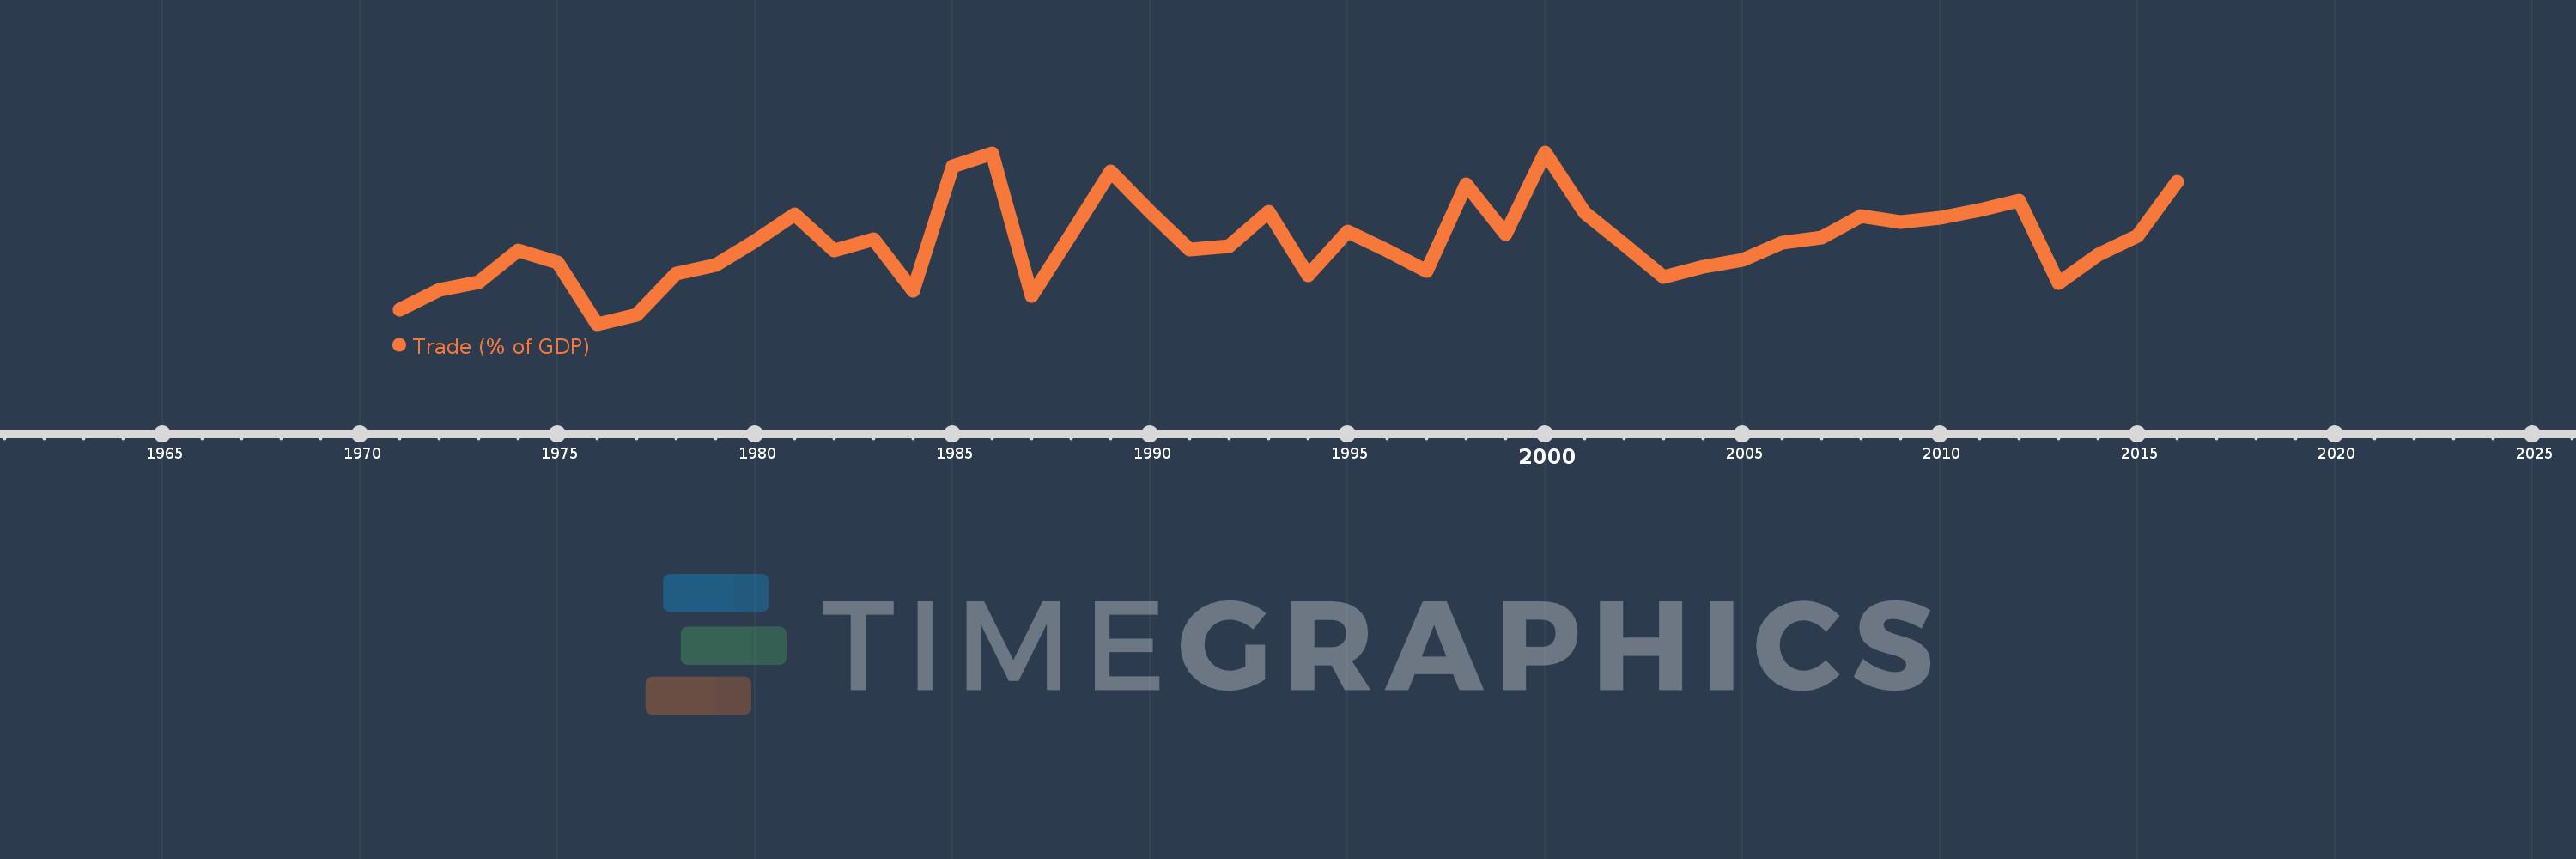
Trade (% of GDP)
2016,2015,2014,2013,2012,2011,2010,2009,2008,2007,2006,2005,2004,2003,2002,2001,2000,1999,1998,1997,1996,1995,1994,1993,1992,1991,1990,1989,1988,1987,1986,1985,1984,1983,1982,1981,1980,1979,1978,1977,1976,1975,1974,1973,1972,1971
This statistics in other country:
AfghanistanAlbaniaAlgeriaAngolaAntigua and BarbudaArab WorldArgentinaArmeniaArubaAustraliaAustriaAzerbaijanBahamas, TheBahrainBangladeshBarbadosBelarusBelgiumBelizeBeninBermudaBhutanBoliviaBosnia and HerzegovinaBotswanaBrazilBrunei DarussalamBulgariaBurkina FasoBurundiCabo VerdeCambodiaCameroonCanadaCaribbean small statesCentral African RepublicCentral Europe and the BalticsChadChileChinaColombiaComorosCongo, Dem. Rep.Congo, Rep.Costa RicaCote d'IvoireCroatiaCubaCyprusCzech RepublicDenmarkDjiboutiDominicaDominican RepublicEarly-demographic dividendEast Asia & PacificEast Asia & Pacific (excluding high income)East Asia & Pacific (IDA & IBRD countries)EcuadorEgypt, Arab Rep.El SalvadorEquatorial GuineaEritreaEstoniaEthiopiaEuro areaEurope & Central AsiaEurope & Central Asia (excluding high income)Europe & Central Asia (IDA & IBRD countries)European UnionFaroe IslandsFijiFinlandFragile and conflict affected situationsFranceFrench PolynesiaGabonGambia, TheGeorgiaGermanyGhanaGreeceGrenadaGuatemalaGuineaGuinea-BissauGuyanaHaitiHeavily indebted poor countries (HIPC)High incomeHondurasHong Kong SAR, ChinaHungaryIBRD onlyIcelandIDA & IBRD totalIDA blendIDA onlyIDA totalIndiaIndonesiaIran, Islamic Rep.IraqIrelandIsraelItalyJamaicaJapanJordanKazakhstanKenyaKiribatiKorea, Rep.KosovoKuwaitKyrgyz RepublicLao PDRLate-demographic dividendLatin America & Caribbean Latin America & Caribbean (excluding high income)Latin America & the Caribbean (IDA & IBRD countries)LatviaLeast developed countries: UN classificationLebanonLesothoLiberiaLibyaLithuaniaLow & middle incomeLow incomeLower middle incomeLuxembourgMacao SAR, ChinaMacedonia, FYRMadagascarMalawiMalaysiaMaldivesMaliMaltaMauritaniaMauritiusMexicoMicronesia, Fed. Sts.Middle East & North AfricaMiddle East & North Africa (excluding high income)Middle East & North Africa (IDA & IBRD countries)Middle incomeMoldovaMongoliaMontenegroMoroccoMozambiqueMyanmarNamibiaNepalNetherlandsNew CaledoniaNew ZealandNicaraguaNigerNigeriaNorth AmericaNorwayOECD membersOmanOther small statesPacific island small statesPakistanPalauPanamaPapua New GuineaParaguayPeruPhilippinesPolandPortugalPost-demographic dividendPre-demographic dividendPuerto RicoQatarRomaniaRussian FederationRwandaSamoaSaudi ArabiaSenegalSerbiaSeychellesSierra LeoneSingaporeSlovak RepublicSloveniaSmall statesSolomon IslandsSomaliaSouth AfricaSouth AsiaSouth Asia (IDA & IBRD)South SudanSpainSri LankaSt. Kitts and NevisSt. LuciaSt. Vincent and the GrenadinesSub-Saharan Africa Sub-Saharan Africa (excluding high income)Sub-Saharan Africa (IDA & IBRD countries)SudanSurinameSwazilandSwedenSwitzerlandSyrian Arab RepublicTajikistanTanzaniaThailandTimor-LesteTogoTongaTrinidad and TobagoTunisiaTurkeyTurkmenistanUgandaUkraineUnited Arab EmiratesUnited KingdomUnited StatesUpper middle incomeUruguayUzbekistanVanuatuVenezuela, RBVietnamWest Bank and GazaWorldYemen, Rep.ZambiaZimbabwe Timeline:
This timeline shows a graph from 1971 to 2016 of Guinea-Bissau. No data until 1970. Number of actual observations by date: 46.
Source name:
World Development Indicators
Source organization:
World Bank national accounts data, and OECD National Accounts data files.
Categories, topics:
Economy & Growth, Trade
Last updated:
apr 23, 2017
Indicators value changes by year
Minimum:
31.132
jan 1, 1976
Maximum:
67.678
jan 1, 2000
At the date of observation
Value
Absolute change
Change from previous value
jan 1, 1971
34.189
+34.189
0.0%
jan 1, 1972
38.47
+4.281
12.52%
jan 1, 1973
39.986
+1.516
3.94%
jan 1, 1974
46.786
+6.801
17.01%
jan 1, 1975
44.267
-2.52
-5.39%
jan 1, 1976
31.132
-13.135
-29.67%
jan 1, 1977
33.208
+2.076
6.67%
jan 1, 1978
41.907
+8.699
26.19%
jan 1, 1979
43.788
+1.881
4.49%
jan 1, 1980
48.799
+5.011
11.44%
jan 1, 1981
54.529
+5.731
11.74%
jan 1, 1982
46.912
-7.618
-13.97%
jan 1, 1983
49.125
+2.214
4.72%
jan 1, 1984
38.263
-10.863
-22.11%
jan 1, 1985
64.683
+26.42
69.05%
jan 1, 1986
67.468
+2.785
4.31%
jan 1, 1987
37.07
-30.397
-45.05%
jan 1, 1988
50.323
+13.253
35.75%
jan 1, 1989
63.609
+13.286
26.4%
jan 1, 1990
55.08
-8.529
-13.41%
jan 1, 1991
46.971
-8.11
-14.72%
jan 1, 1992
47.774
+0.803
1.71%
jan 1, 1993
55.014
+7.241
15.16%
jan 1, 1994
41.586
-13.428
-24.41%
jan 1, 1995
50.764
+9.177
22.07%
jan 1, 1996
46.81
-3.953
-7.79%
jan 1, 1997
42.36
-4.45
-9.51%
jan 1, 1998
60.9
+18.54
43.77%
jan 1, 1999
50.287
-10.613
-17.43%
jan 1, 2000
67.678
+17.391
34.58%
jan 1, 2001
54.873
-12.804
-18.92%
jan 1, 2002
48.018
-6.856
-12.49%
jan 1, 2003
41.184
-6.833
-14.23%
jan 1, 2004
43.272
+2.087
5.07%
jan 1, 2005
44.845
+1.573
3.64%
jan 1, 2006
48.428
+3.583
7.99%
jan 1, 2007
49.541
+1.114
2.3%
jan 1, 2008
54.117
+4.576
9.24%
jan 1, 2009
52.768
-1.349
-2.49%
jan 1, 2010
53.761
+0.994
1.88%
jan 1, 2011
55.327
+1.566
2.91%
jan 1, 2012
57.472
+2.145
3.88%
jan 1, 2013
39.876
-17.595
-30.62%
jan 1, 2014
45.948
+6.072
15.23%
jan 1, 2015
50.019
+4.071
8.86%
jan 1, 2016
61.517
+11.498
22.99%
Ranking of countries by current statistics by years


Comments: