29
/
en
AIzaSyAYiBZKx7MnpbEhh9jyipgxe19OcubqV5w
April 1, 2024
207540
Nepal
NPL
true
2
1
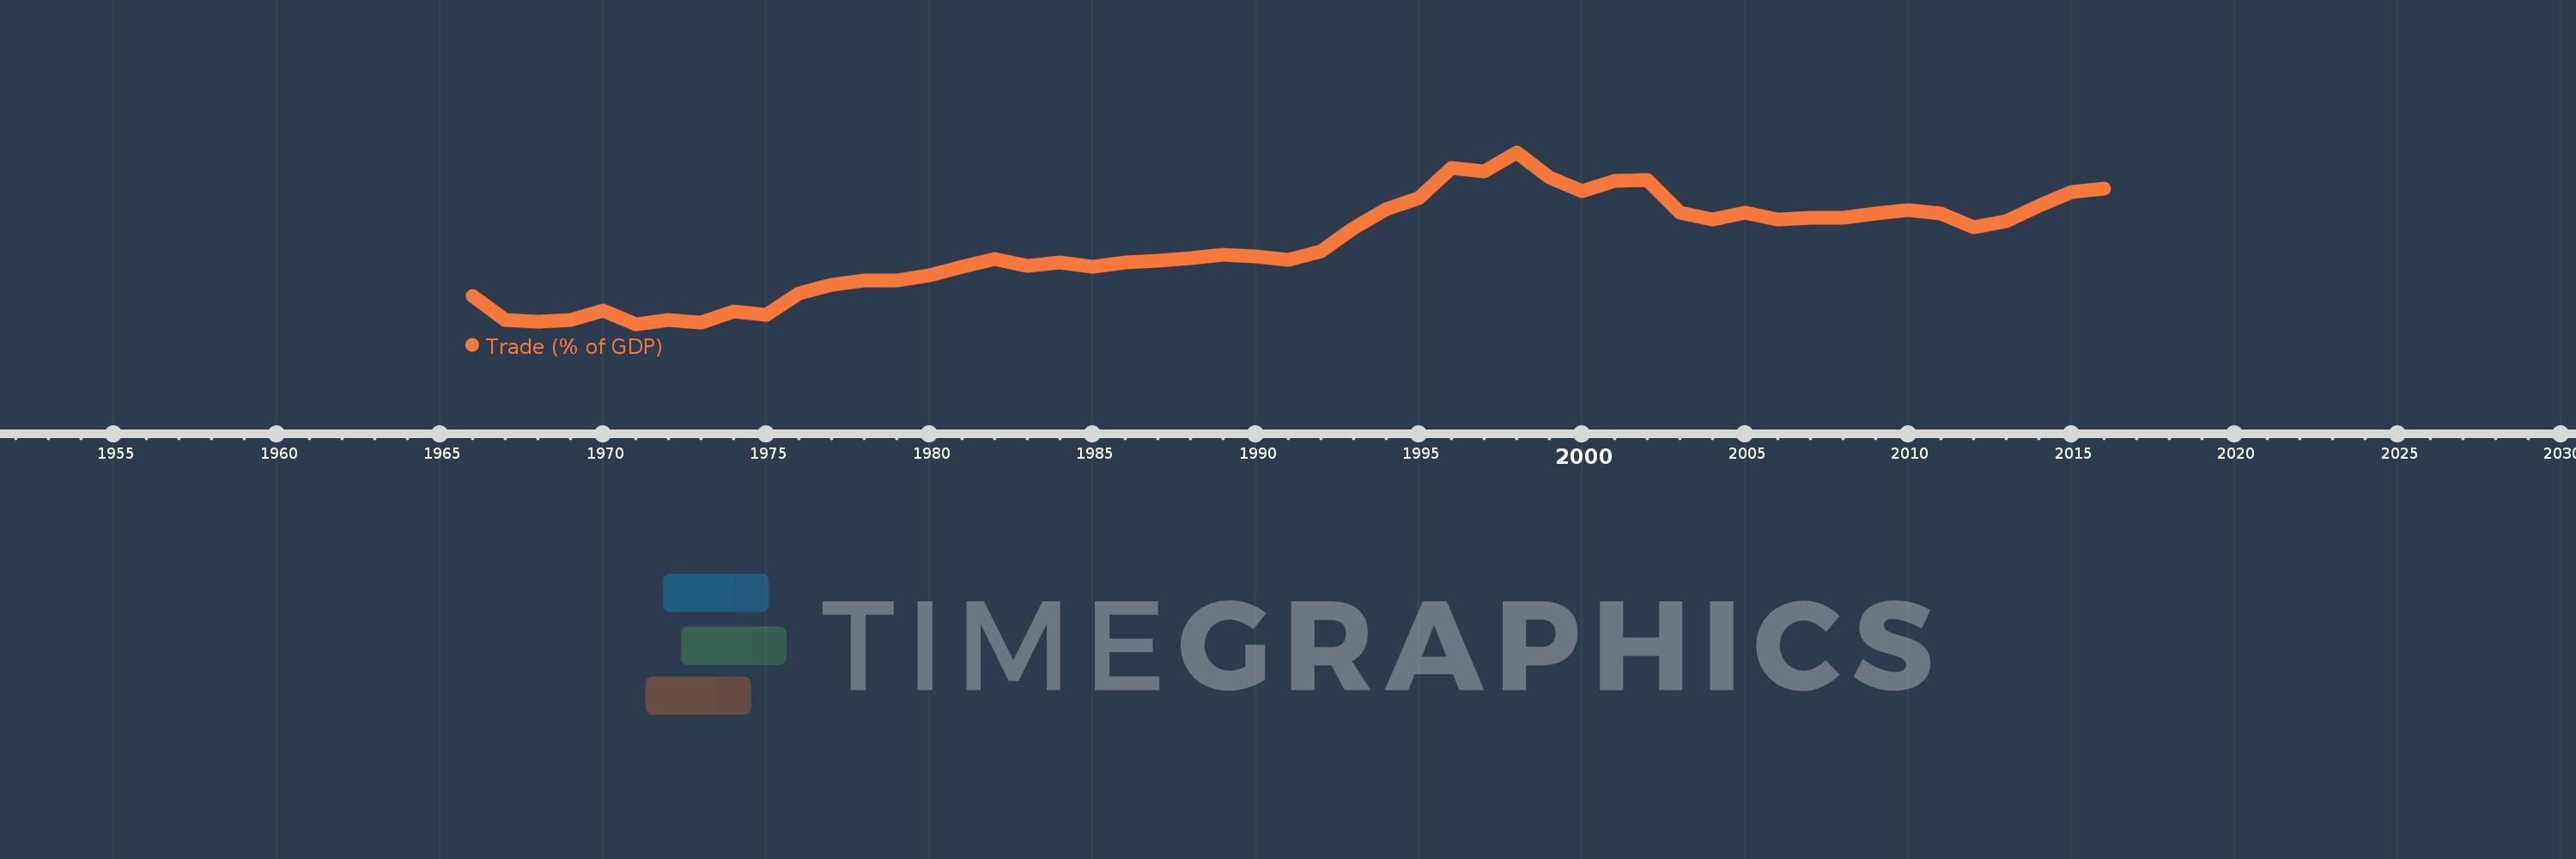
Trade (% of GDP)
2016,2015,2014,2013,2012,2011,2010,2009,2008,2007,2006,2005,2004,2003,2002,2001,2000,1999,1998,1997,1996,1995,1994,1993,1992,1991,1990,1989,1988,1987,1986,1985,1984,1983,1982,1981,1980,1979,1978,1977,1976,1975,1974,1973,1972,1971,1970,1969,1968,1967,1966
This statistics in other country:
AfghanistanAlbaniaAlgeriaAngolaAntigua and BarbudaArab WorldArgentinaArmeniaArubaAustraliaAustriaAzerbaijanBahamas, TheBahrainBangladeshBarbadosBelarusBelgiumBelizeBeninBermudaBhutanBoliviaBosnia and HerzegovinaBotswanaBrazilBrunei DarussalamBulgariaBurkina FasoBurundiCabo VerdeCambodiaCameroonCanadaCaribbean small statesCentral African RepublicCentral Europe and the BalticsChadChileChinaColombiaComorosCongo, Dem. Rep.Congo, Rep.Costa RicaCote d'IvoireCroatiaCubaCyprusCzech RepublicDenmarkDjiboutiDominicaDominican RepublicEarly-demographic dividendEast Asia & PacificEast Asia & Pacific (excluding high income)East Asia & Pacific (IDA & IBRD countries)EcuadorEgypt, Arab Rep.El SalvadorEquatorial GuineaEritreaEstoniaEthiopiaEuro areaEurope & Central AsiaEurope & Central Asia (excluding high income)Europe & Central Asia (IDA & IBRD countries)European UnionFaroe IslandsFijiFinlandFragile and conflict affected situationsFranceFrench PolynesiaGabonGambia, TheGeorgiaGermanyGhanaGreeceGrenadaGuatemalaGuineaGuinea-BissauGuyanaHaitiHeavily indebted poor countries (HIPC)High incomeHondurasHong Kong SAR, ChinaHungaryIBRD onlyIcelandIDA & IBRD totalIDA blendIDA onlyIDA totalIndiaIndonesiaIran, Islamic Rep.IraqIrelandIsraelItalyJamaicaJapanJordanKazakhstanKenyaKiribatiKorea, Rep.KosovoKuwaitKyrgyz RepublicLao PDRLate-demographic dividendLatin America & Caribbean Latin America & Caribbean (excluding high income)Latin America & the Caribbean (IDA & IBRD countries)LatviaLeast developed countries: UN classificationLebanonLesothoLiberiaLibyaLithuaniaLow & middle incomeLow incomeLower middle incomeLuxembourgMacao SAR, ChinaMacedonia, FYRMadagascarMalawiMalaysiaMaldivesMaliMaltaMauritaniaMauritiusMexicoMicronesia, Fed. Sts.Middle East & North AfricaMiddle East & North Africa (excluding high income)Middle East & North Africa (IDA & IBRD countries)Middle incomeMoldovaMongoliaMontenegroMoroccoMozambiqueMyanmarNamibiaNepalNetherlandsNew CaledoniaNew ZealandNicaraguaNigerNigeriaNorth AmericaNorwayOECD membersOmanOther small statesPacific island small statesPakistanPalauPanamaPapua New GuineaParaguayPeruPhilippinesPolandPortugalPost-demographic dividendPre-demographic dividendPuerto RicoQatarRomaniaRussian FederationRwandaSamoaSaudi ArabiaSenegalSerbiaSeychellesSierra LeoneSingaporeSlovak RepublicSloveniaSmall statesSolomon IslandsSomaliaSouth AfricaSouth AsiaSouth Asia (IDA & IBRD)South SudanSpainSri LankaSt. Kitts and NevisSt. LuciaSt. Vincent and the GrenadinesSub-Saharan Africa Sub-Saharan Africa (excluding high income)Sub-Saharan Africa (IDA & IBRD countries)SudanSurinameSwazilandSwedenSwitzerlandSyrian Arab RepublicTajikistanTanzaniaThailandTimor-LesteTogoTongaTrinidad and TobagoTunisiaTurkeyTurkmenistanUgandaUkraineUnited Arab EmiratesUnited KingdomUnited StatesUpper middle incomeUruguayUzbekistanVanuatuVenezuela, RBVietnamWest Bank and GazaWorldYemen, Rep.ZambiaZimbabwe Timeline:
This timeline shows a graph from 1966 to 2016 of Nepal. No data until 1965. Number of actual observations by date: 51.
Source name:
World Development Indicators
Source organization:
World Bank national accounts data, and OECD National Accounts data files.
Categories, topics:
Economy & Growth, Trade
Last updated:
apr 23, 2017
Indicators value changes by year
Minimum:
13.207
jan 1, 1971
Maximum:
64.036
jan 1, 1998
At the date of observation
Value
Absolute change
Change from previous value
jan 1, 1966
21.689
+21.689
0.0%
jan 1, 1967
14.402
-7.287
-33.6%
jan 1, 1968
13.827
-0.575
-3.99%
jan 1, 1969
14.345
+0.518
3.75%
jan 1, 1970
17.232
+2.887
20.12%
jan 1, 1971
13.207
-4.025
-23.36%
jan 1, 1972
14.533
+1.326
10.04%
jan 1, 1973
13.579
-0.955
-6.57%
jan 1, 1974
16.983
+3.404
25.07%
jan 1, 1975
15.998
-0.985
-5.8%
jan 1, 1976
22.268
+6.27
39.19%
jan 1, 1977
24.951
+2.683
12.05%
jan 1, 1978
26.105
+1.154
4.63%
jan 1, 1979
26.044
-0.061
-0.23%
jan 1, 1980
27.752
+1.708
6.56%
jan 1, 1981
30.273
+2.521
9.09%
jan 1, 1982
32.519
+2.246
7.42%
jan 1, 1983
30.399
-2.12
-6.52%
jan 1, 1984
31.546
+1.147
3.77%
jan 1, 1985
30.102
-1.445
-4.58%
jan 1, 1986
31.529
+1.427
4.74%
jan 1, 1987
31.965
+0.436
1.38%
jan 1, 1988
32.72
+0.755
2.36%
jan 1, 1989
33.829
+1.109
3.39%
jan 1, 1990
33.351
-0.478
-1.41%
jan 1, 1991
32.189
-1.162
-3.48%
jan 1, 1992
34.675
+2.486
7.72%
jan 1, 1993
41.695
+7.02
20.25%
jan 1, 1994
47.19
+5.494
13.18%
jan 1, 1995
50.432
+3.242
6.87%
jan 1, 1996
59.491
+9.058
17.96%
jan 1, 1997
58.458
-1.033
-1.74%
jan 1, 1998
64.036
+5.578
9.54%
jan 1, 1999
56.71
-7.326
-11.44%
jan 1, 2000
52.567
-4.143
-7.3%
jan 1, 2001
55.711
+3.144
5.98%
jan 1, 2002
55.8
+0.089
0.16%
jan 1, 2003
46.231
-9.569
-17.15%
jan 1, 2004
44.248
-1.983
-4.29%
jan 1, 2005
46.147
+1.899
4.29%
jan 1, 2006
44.063
-2.084
-4.52%
jan 1, 2007
44.762
+0.699
1.59%
jan 1, 2008
44.579
-0.183
-0.41%
jan 1, 2009
46.036
+1.457
3.27%
jan 1, 2010
47.079
+1.043
2.27%
jan 1, 2011
45.985
-1.095
-2.32%
jan 1, 2012
41.828
-4.157
-9.04%
jan 1, 2013
43.658
+1.83
4.37%
jan 1, 2014
48.146
+4.488
10.28%
jan 1, 2015
52.255
+4.109
8.53%
jan 1, 2016
53.338
+1.082
2.07%
Ranking of countries by current statistics by years


Comments: