29
/
en
AIzaSyAYiBZKx7MnpbEhh9jyipgxe19OcubqV5w
April 1, 2024
100703
Cameroon
CMR
true
2
1
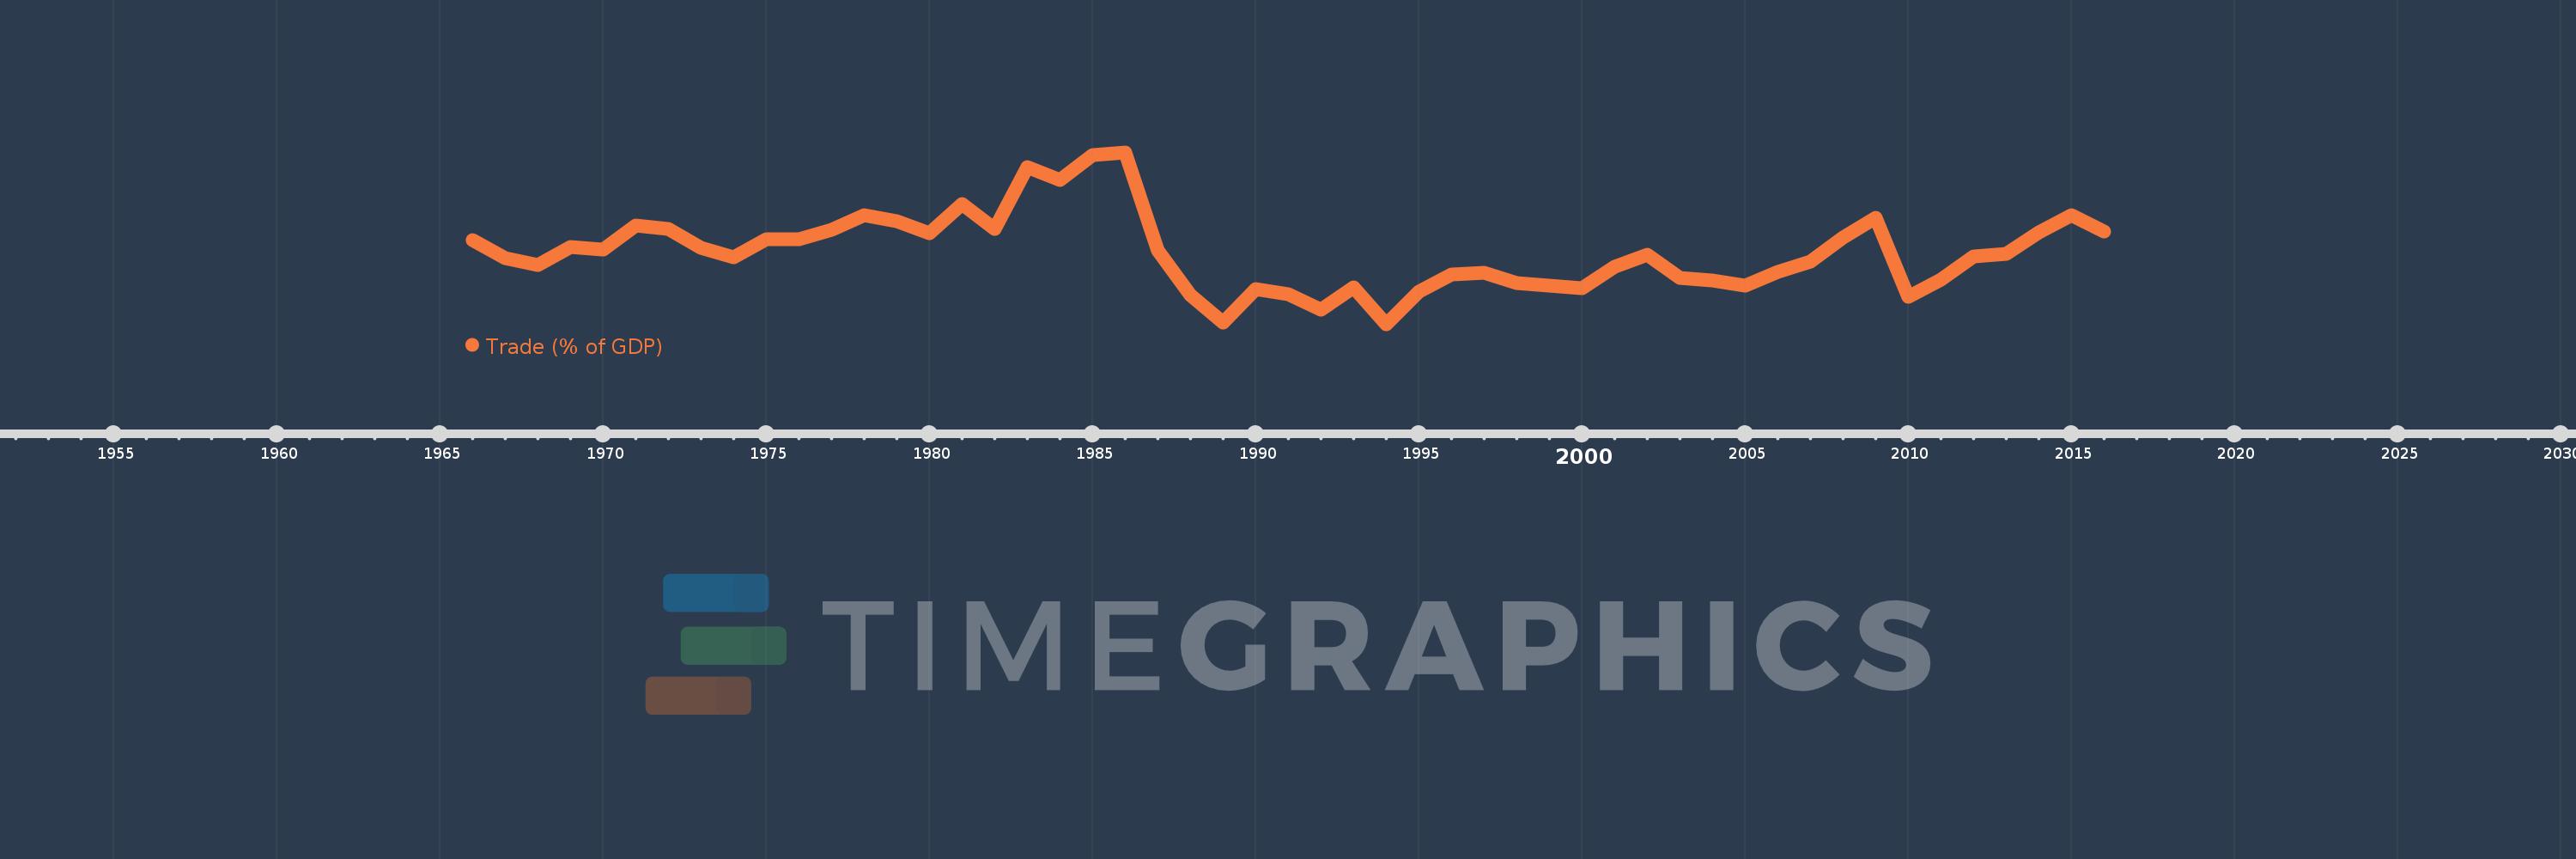
Trade (% of GDP)
2016,2015,2014,2013,2012,2011,2010,2009,2008,2007,2006,2005,2004,2003,2002,2001,2000,1999,1998,1997,1996,1995,1994,1993,1992,1991,1990,1989,1988,1987,1986,1985,1984,1983,1982,1981,1980,1979,1978,1977,1976,1975,1974,1973,1972,1971,1970,1969,1968,1967,1966
This statistics in other country:
AfghanistanAlbaniaAlgeriaAngolaAntigua and BarbudaArab WorldArgentinaArmeniaArubaAustraliaAustriaAzerbaijanBahamas, TheBahrainBangladeshBarbadosBelarusBelgiumBelizeBeninBermudaBhutanBoliviaBosnia and HerzegovinaBotswanaBrazilBrunei DarussalamBulgariaBurkina FasoBurundiCabo VerdeCambodiaCameroonCanadaCaribbean small statesCentral African RepublicCentral Europe and the BalticsChadChileChinaColombiaComorosCongo, Dem. Rep.Congo, Rep.Costa RicaCote d'IvoireCroatiaCubaCyprusCzech RepublicDenmarkDjiboutiDominicaDominican RepublicEarly-demographic dividendEast Asia & PacificEast Asia & Pacific (excluding high income)East Asia & Pacific (IDA & IBRD countries)EcuadorEgypt, Arab Rep.El SalvadorEquatorial GuineaEritreaEstoniaEthiopiaEuro areaEurope & Central AsiaEurope & Central Asia (excluding high income)Europe & Central Asia (IDA & IBRD countries)European UnionFaroe IslandsFijiFinlandFragile and conflict affected situationsFranceFrench PolynesiaGabonGambia, TheGeorgiaGermanyGhanaGreeceGrenadaGuatemalaGuineaGuinea-BissauGuyanaHaitiHeavily indebted poor countries (HIPC)High incomeHondurasHong Kong SAR, ChinaHungaryIBRD onlyIcelandIDA & IBRD totalIDA blendIDA onlyIDA totalIndiaIndonesiaIran, Islamic Rep.IraqIrelandIsraelItalyJamaicaJapanJordanKazakhstanKenyaKiribatiKorea, Rep.KosovoKuwaitKyrgyz RepublicLao PDRLate-demographic dividendLatin America & Caribbean Latin America & Caribbean (excluding high income)Latin America & the Caribbean (IDA & IBRD countries)LatviaLeast developed countries: UN classificationLebanonLesothoLiberiaLibyaLithuaniaLow & middle incomeLow incomeLower middle incomeLuxembourgMacao SAR, ChinaMacedonia, FYRMadagascarMalawiMalaysiaMaldivesMaliMaltaMauritaniaMauritiusMexicoMicronesia, Fed. Sts.Middle East & North AfricaMiddle East & North Africa (excluding high income)Middle East & North Africa (IDA & IBRD countries)Middle incomeMoldovaMongoliaMontenegroMoroccoMozambiqueMyanmarNamibiaNepalNetherlandsNew CaledoniaNew ZealandNicaraguaNigerNigeriaNorth AmericaNorwayOECD membersOmanOther small statesPacific island small statesPakistanPalauPanamaPapua New GuineaParaguayPeruPhilippinesPolandPortugalPost-demographic dividendPre-demographic dividendPuerto RicoQatarRomaniaRussian FederationRwandaSamoaSaudi ArabiaSenegalSerbiaSeychellesSierra LeoneSingaporeSlovak RepublicSloveniaSmall statesSolomon IslandsSomaliaSouth AfricaSouth AsiaSouth Asia (IDA & IBRD)South SudanSpainSri LankaSt. Kitts and NevisSt. LuciaSt. Vincent and the GrenadinesSub-Saharan Africa Sub-Saharan Africa (excluding high income)Sub-Saharan Africa (IDA & IBRD countries)SudanSurinameSwazilandSwedenSwitzerlandSyrian Arab RepublicTajikistanTanzaniaThailandTimor-LesteTogoTongaTrinidad and TobagoTunisiaTurkeyTurkmenistanUgandaUkraineUnited Arab EmiratesUnited KingdomUnited StatesUpper middle incomeUruguayUzbekistanVanuatuVenezuela, RBVietnamWest Bank and GazaWorldYemen, Rep.ZambiaZimbabwe Timeline:
This timeline shows a graph from 1966 to 2016 of Cameroon. No data until 1965. Number of actual observations by date: 51.
Source name:
World Development Indicators
Source organization:
World Bank national accounts data, and OECD National Accounts data files.
Categories, topics:
Economy & Growth, Trade
Last updated:
apr 23, 2017
Indicators value changes by year
Minimum:
31.745
jan 1, 1994
Maximum:
65.025
jan 1, 1986
At the date of observation
Value
Absolute change
Change from previous value
jan 1, 1966
48.02
+48.02
0.0%
jan 1, 1967
44.572
-3.448
-7.18%
jan 1, 1968
43.205
-1.367
-3.07%
jan 1, 1969
46.757
+3.552
8.22%
jan 1, 1970
46.243
-0.514
-1.1%
jan 1, 1971
50.88
+4.637
10.03%
jan 1, 1972
50.176
-0.704
-1.38%
jan 1, 1973
46.478
-3.699
-7.37%
jan 1, 1974
44.691
-1.787
-3.84%
jan 1, 1975
48.238
+3.547
7.94%
jan 1, 1976
48.228
-0.01
-0.02%
jan 1, 1977
50.007
+1.779
3.69%
jan 1, 1978
52.866
+2.858
5.72%
jan 1, 1979
51.777
-1.088
-2.06%
jan 1, 1980
49.321
-2.456
-4.74%
jan 1, 1981
55.016
+5.695
11.55%
jan 1, 1982
50.281
-4.735
-8.61%
jan 1, 1983
62.125
+11.844
23.56%
jan 1, 1984
59.701
-2.424
-3.9%
jan 1, 1985
64.472
+4.771
7.99%
jan 1, 1986
65.025
+0.553
0.86%
jan 1, 1987
46.006
-19.019
-29.25%
jan 1, 1988
37.32
-8.686
-18.88%
jan 1, 1989
31.995
-5.326
-14.27%
jan 1, 1990
38.476
+6.482
20.26%
jan 1, 1991
37.496
-0.98
-2.55%
jan 1, 1992
34.639
-2.858
-7.62%
jan 1, 1993
38.863
+4.224
12.19%
jan 1, 1994
31.745
-7.117
-18.31%
jan 1, 1995
38.024
+6.279
19.78%
jan 1, 1996
41.369
+3.345
8.8%
jan 1, 1997
41.773
+0.404
0.98%
jan 1, 1998
39.788
-1.985
-4.75%
jan 1, 1999
39.137
-0.651
-1.64%
jan 1, 2000
38.667
-0.47
-1.2%
jan 1, 2001
42.915
+4.248
10.99%
jan 1, 2002
45.134
+2.22
5.17%
jan 1, 2003
40.65
-4.484
-9.94%
jan 1, 2004
40.15
-0.5
-1.23%
jan 1, 2005
39.231
-0.918
-2.29%
jan 1, 2006
41.926
+2.695
6.87%
jan 1, 2007
43.958
+2.032
4.85%
jan 1, 2008
48.536
+4.578
10.41%
jan 1, 2009
52.342
+3.807
7.84%
jan 1, 2010
37.065
-15.277
-29.19%
jan 1, 2011
40.361
+3.296
8.89%
jan 1, 2012
44.86
+4.499
11.15%
jan 1, 2013
45.403
+0.543
1.21%
jan 1, 2014
49.567
+4.164
9.17%
jan 1, 2015
52.886
+3.32
6.7%
jan 1, 2016
49.632
-3.255
-6.15%
Ranking of countries by current statistics by years


Comments: