29
/
en
AIzaSyAYiBZKx7MnpbEhh9jyipgxe19OcubqV5w
April 1, 2024
203715
Mozambique
MOZ
true
2
1
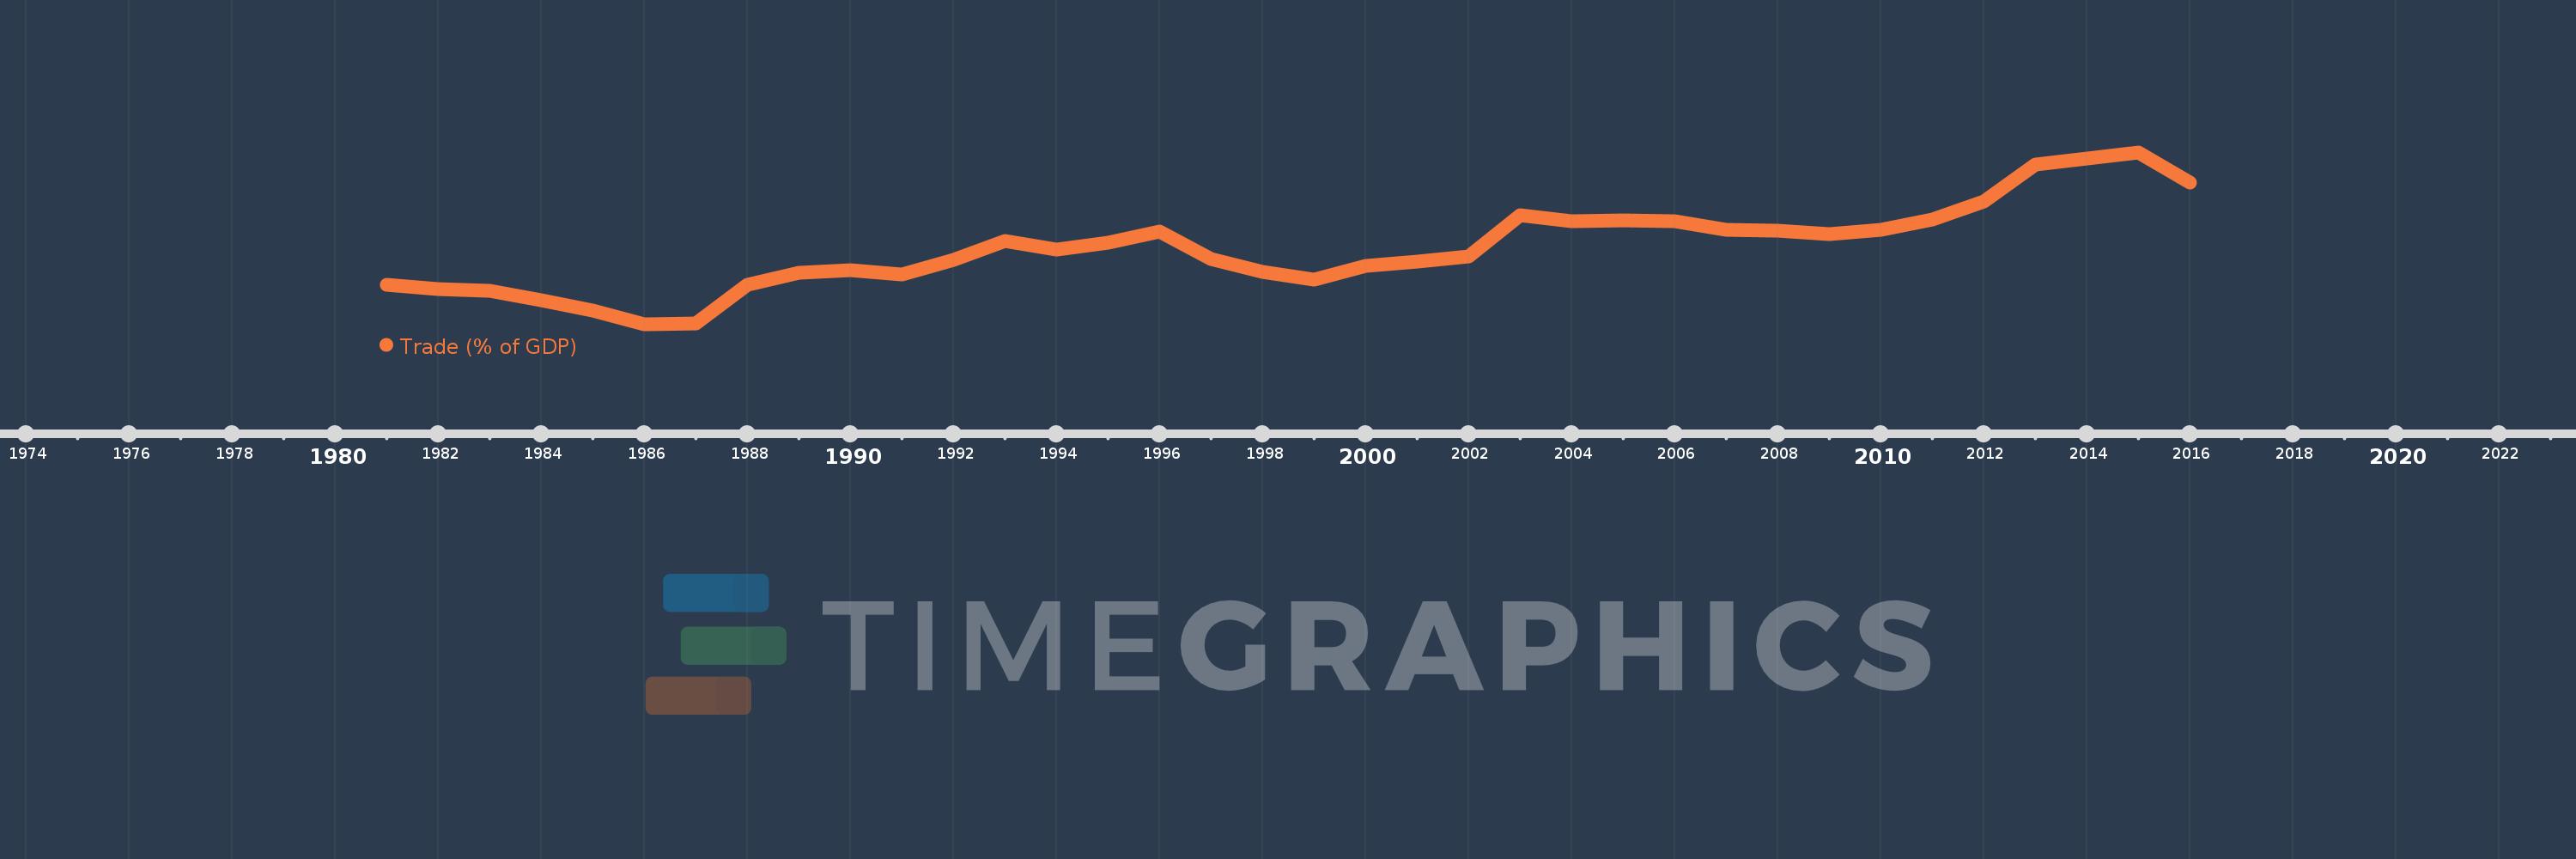
Trade (% of GDP)
2016,2015,2014,2013,2012,2011,2010,2009,2008,2007,2006,2005,2004,2003,2002,2001,2000,1999,1998,1997,1996,1995,1994,1993,1992,1991,1990,1989,1988,1987,1986,1985,1984,1983,1982,1981
This statistics in other country:
AfghanistanAlbaniaAlgeriaAngolaAntigua and BarbudaArab WorldArgentinaArmeniaArubaAustraliaAustriaAzerbaijanBahamas, TheBahrainBangladeshBarbadosBelarusBelgiumBelizeBeninBermudaBhutanBoliviaBosnia and HerzegovinaBotswanaBrazilBrunei DarussalamBulgariaBurkina FasoBurundiCabo VerdeCambodiaCameroonCanadaCaribbean small statesCentral African RepublicCentral Europe and the BalticsChadChileChinaColombiaComorosCongo, Dem. Rep.Congo, Rep.Costa RicaCote d'IvoireCroatiaCubaCyprusCzech RepublicDenmarkDjiboutiDominicaDominican RepublicEarly-demographic dividendEast Asia & PacificEast Asia & Pacific (excluding high income)East Asia & Pacific (IDA & IBRD countries)EcuadorEgypt, Arab Rep.El SalvadorEquatorial GuineaEritreaEstoniaEthiopiaEuro areaEurope & Central AsiaEurope & Central Asia (excluding high income)Europe & Central Asia (IDA & IBRD countries)European UnionFaroe IslandsFijiFinlandFragile and conflict affected situationsFranceFrench PolynesiaGabonGambia, TheGeorgiaGermanyGhanaGreeceGrenadaGuatemalaGuineaGuinea-BissauGuyanaHaitiHeavily indebted poor countries (HIPC)High incomeHondurasHong Kong SAR, ChinaHungaryIBRD onlyIcelandIDA & IBRD totalIDA blendIDA onlyIDA totalIndiaIndonesiaIran, Islamic Rep.IraqIrelandIsraelItalyJamaicaJapanJordanKazakhstanKenyaKiribatiKorea, Rep.KosovoKuwaitKyrgyz RepublicLao PDRLate-demographic dividendLatin America & Caribbean Latin America & Caribbean (excluding high income)Latin America & the Caribbean (IDA & IBRD countries)LatviaLeast developed countries: UN classificationLebanonLesothoLiberiaLibyaLithuaniaLow & middle incomeLow incomeLower middle incomeLuxembourgMacao SAR, ChinaMacedonia, FYRMadagascarMalawiMalaysiaMaldivesMaliMaltaMauritaniaMauritiusMexicoMicronesia, Fed. Sts.Middle East & North AfricaMiddle East & North Africa (excluding high income)Middle East & North Africa (IDA & IBRD countries)Middle incomeMoldovaMongoliaMontenegroMoroccoMozambiqueMyanmarNamibiaNepalNetherlandsNew CaledoniaNew ZealandNicaraguaNigerNigeriaNorth AmericaNorwayOECD membersOmanOther small statesPacific island small statesPakistanPalauPanamaPapua New GuineaParaguayPeruPhilippinesPolandPortugalPost-demographic dividendPre-demographic dividendPuerto RicoQatarRomaniaRussian FederationRwandaSamoaSaudi ArabiaSenegalSerbiaSeychellesSierra LeoneSingaporeSlovak RepublicSloveniaSmall statesSolomon IslandsSomaliaSouth AfricaSouth AsiaSouth Asia (IDA & IBRD)South SudanSpainSri LankaSt. Kitts and NevisSt. LuciaSt. Vincent and the GrenadinesSub-Saharan Africa Sub-Saharan Africa (excluding high income)Sub-Saharan Africa (IDA & IBRD countries)SudanSurinameSwazilandSwedenSwitzerlandSyrian Arab RepublicTajikistanTanzaniaThailandTimor-LesteTogoTongaTrinidad and TobagoTunisiaTurkeyTurkmenistanUgandaUkraineUnited Arab EmiratesUnited KingdomUnited StatesUpper middle incomeUruguayUzbekistanVanuatuVenezuela, RBVietnamWest Bank and GazaWorldYemen, Rep.ZambiaZimbabwe Timeline:
This timeline shows a graph from 1981 to 2016 of Mozambique. No data until 1980. Number of actual observations by date: 36.
Source name:
World Development Indicators
Source organization:
World Bank national accounts data, and OECD National Accounts data files.
Categories, topics:
Economy & Growth, Trade
Last updated:
apr 23, 2017
Indicators value changes by year
Minimum:
14.326
jan 1, 1986
Maximum:
118.123
jan 1, 2015
At the date of observation
Value
Absolute change
Change from previous value
jan 1, 1981
38.221
+38.221
0.0%
jan 1, 1982
35.704
-2.517
-6.59%
jan 1, 1983
34.528
-1.176
-3.29%
jan 1, 1984
28.881
-5.648
-16.36%
jan 1, 1985
22.506
-6.375
-22.07%
jan 1, 1986
14.326
-8.18
-36.35%
jan 1, 1987
14.551
+0.225
1.57%
jan 1, 1988
38.026
+23.475
161.33%
jan 1, 1989
45.368
+7.342
19.31%
jan 1, 1990
46.872
+1.504
3.31%
jan 1, 1991
44.242
-2.63
-5.61%
jan 1, 1992
53.328
+9.086
20.54%
jan 1, 1993
64.797
+11.469
21.51%
jan 1, 1994
59.631
-5.166
-7.97%
jan 1, 1995
63.757
+4.126
6.92%
jan 1, 1996
70.135
+6.378
10.0%
jan 1, 1997
53.721
-16.413
-23.4%
jan 1, 1998
46.084
-7.637
-14.22%
jan 1, 1999
41.132
-4.952
-10.75%
jan 1, 2000
49.686
+8.554
20.8%
jan 1, 2001
52.396
+2.71
5.45%
jan 1, 2002
55.418
+3.021
5.77%
jan 1, 2003
80.416
+24.999
45.11%
jan 1, 2004
76.51
-3.907
-4.86%
jan 1, 2005
77.205
+0.696
0.91%
jan 1, 2006
76.368
-0.838
-1.08%
jan 1, 2007
71.202
-5.166
-6.76%
jan 1, 2008
70.749
-0.452
-0.64%
jan 1, 2009
68.511
-2.239
-3.16%
jan 1, 2010
71.247
+2.736
3.99%
jan 1, 2011
77.732
+6.485
9.1%
jan 1, 2012
88.334
+10.603
13.64%
jan 1, 2013
110.83
+22.495
25.47%
jan 1, 2014
114.376
+3.546
3.2%
jan 1, 2015
118.123
+3.747
3.28%
jan 1, 2016
99.69
-18.432
-15.6%
Ranking of countries by current statistics by years


Comments: