29
/
en
AIzaSyAYiBZKx7MnpbEhh9jyipgxe19OcubqV5w
April 1, 2024
132755
Fiji
FJI
true
2
1
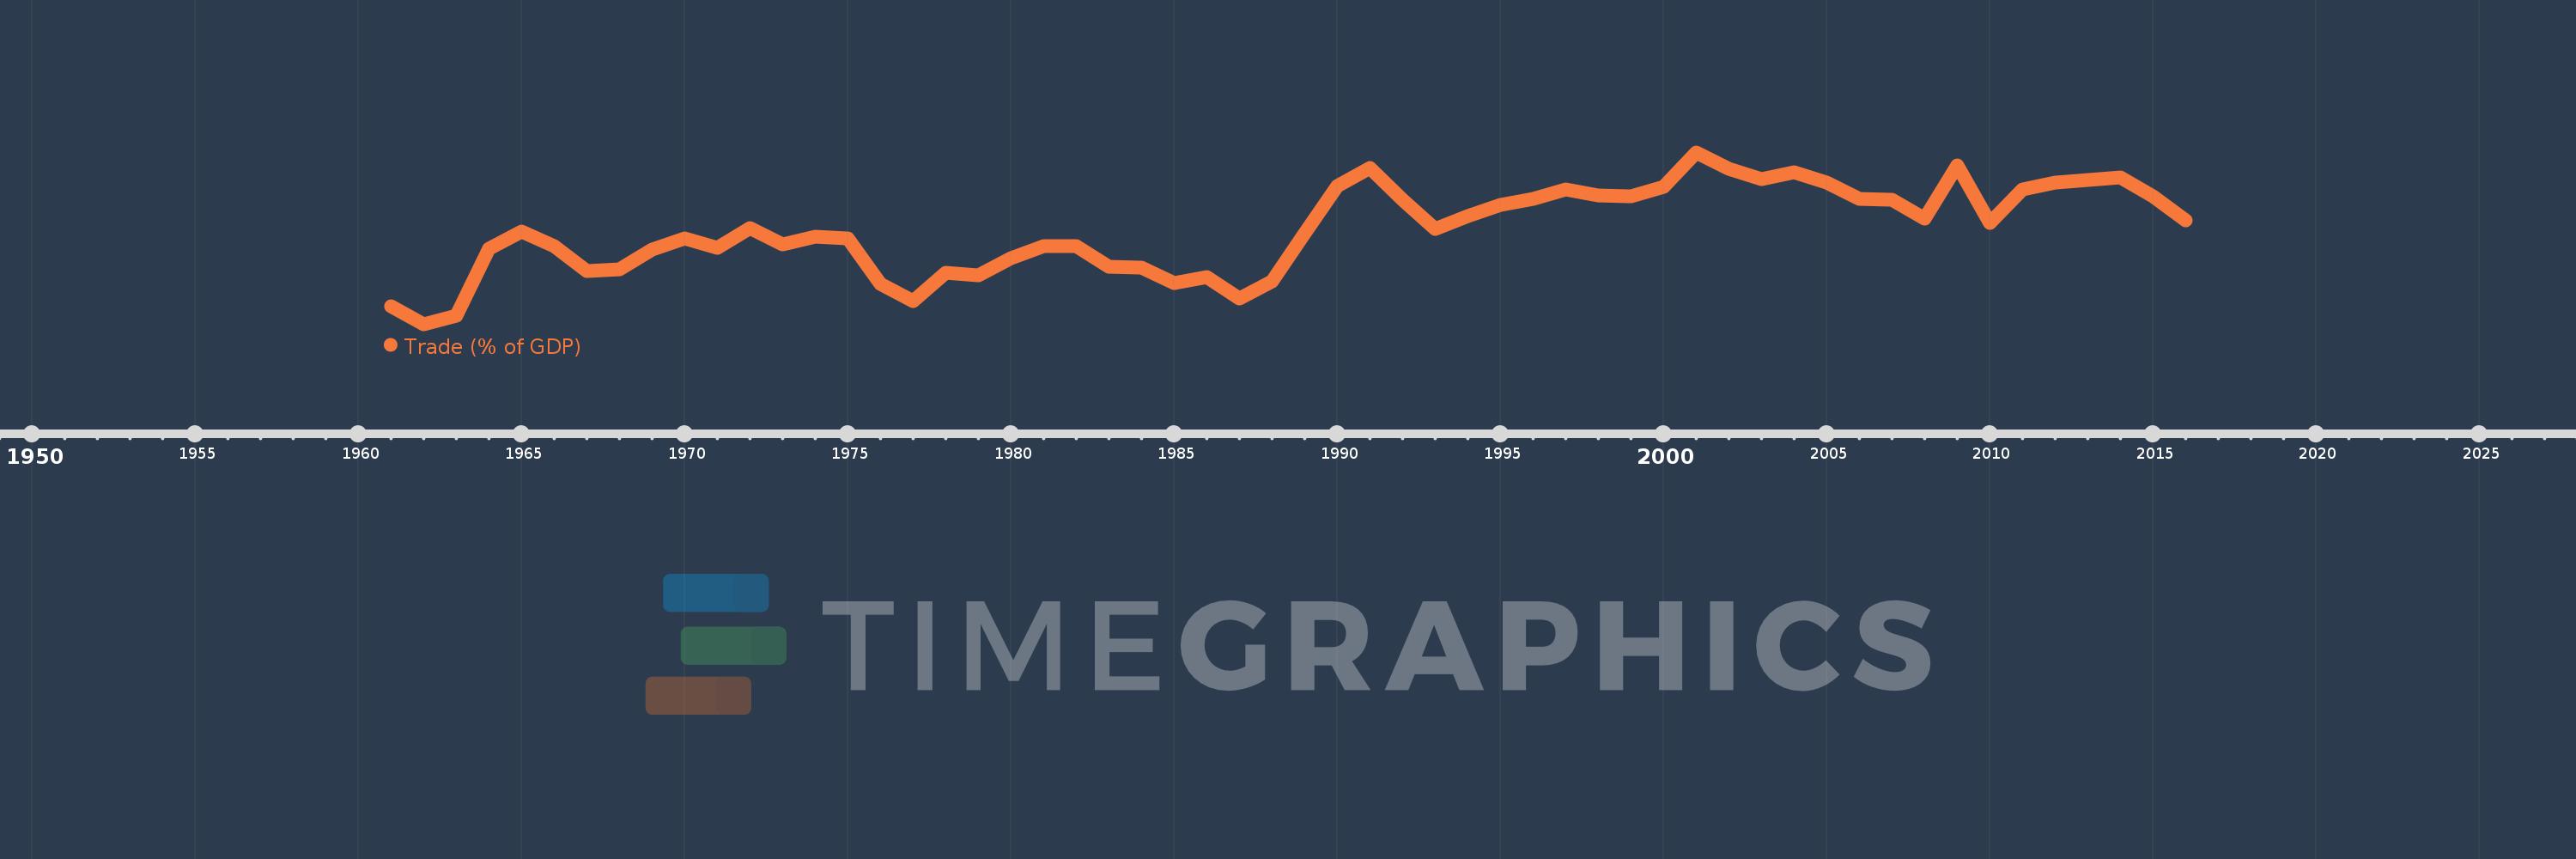
Trade (% of GDP)
2016,2015,2014,2013,2012,2011,2010,2009,2008,2007,2006,2005,2004,2003,2002,2001,2000,1999,1998,1997,1996,1995,1994,1993,1992,1991,1990,1989,1988,1987,1986,1985,1984,1983,1982,1981,1980,1979,1978,1977,1976,1975,1974,1973,1972,1971,1970,1969,1968,1967,1966,1965,1964,1963,1962,1961
This statistics in other country:
AfghanistanAlbaniaAlgeriaAngolaAntigua and BarbudaArab WorldArgentinaArmeniaArubaAustraliaAustriaAzerbaijanBahamas, TheBahrainBangladeshBarbadosBelarusBelgiumBelizeBeninBermudaBhutanBoliviaBosnia and HerzegovinaBotswanaBrazilBrunei DarussalamBulgariaBurkina FasoBurundiCabo VerdeCambodiaCameroonCanadaCaribbean small statesCentral African RepublicCentral Europe and the BalticsChadChileChinaColombiaComorosCongo, Dem. Rep.Congo, Rep.Costa RicaCote d'IvoireCroatiaCubaCyprusCzech RepublicDenmarkDjiboutiDominicaDominican RepublicEarly-demographic dividendEast Asia & PacificEast Asia & Pacific (excluding high income)East Asia & Pacific (IDA & IBRD countries)EcuadorEgypt, Arab Rep.El SalvadorEquatorial GuineaEritreaEstoniaEthiopiaEuro areaEurope & Central AsiaEurope & Central Asia (excluding high income)Europe & Central Asia (IDA & IBRD countries)European UnionFaroe IslandsFijiFinlandFragile and conflict affected situationsFranceFrench PolynesiaGabonGambia, TheGeorgiaGermanyGhanaGreeceGrenadaGuatemalaGuineaGuinea-BissauGuyanaHaitiHeavily indebted poor countries (HIPC)High incomeHondurasHong Kong SAR, ChinaHungaryIBRD onlyIcelandIDA & IBRD totalIDA blendIDA onlyIDA totalIndiaIndonesiaIran, Islamic Rep.IraqIrelandIsraelItalyJamaicaJapanJordanKazakhstanKenyaKiribatiKorea, Rep.KosovoKuwaitKyrgyz RepublicLao PDRLate-demographic dividendLatin America & Caribbean Latin America & Caribbean (excluding high income)Latin America & the Caribbean (IDA & IBRD countries)LatviaLeast developed countries: UN classificationLebanonLesothoLiberiaLibyaLithuaniaLow & middle incomeLow incomeLower middle incomeLuxembourgMacao SAR, ChinaMacedonia, FYRMadagascarMalawiMalaysiaMaldivesMaliMaltaMauritaniaMauritiusMexicoMicronesia, Fed. Sts.Middle East & North AfricaMiddle East & North Africa (excluding high income)Middle East & North Africa (IDA & IBRD countries)Middle incomeMoldovaMongoliaMontenegroMoroccoMozambiqueMyanmarNamibiaNepalNetherlandsNew CaledoniaNew ZealandNicaraguaNigerNigeriaNorth AmericaNorwayOECD membersOmanOther small statesPacific island small statesPakistanPalauPanamaPapua New GuineaParaguayPeruPhilippinesPolandPortugalPost-demographic dividendPre-demographic dividendPuerto RicoQatarRomaniaRussian FederationRwandaSamoaSaudi ArabiaSenegalSerbiaSeychellesSierra LeoneSingaporeSlovak RepublicSloveniaSmall statesSolomon IslandsSomaliaSouth AfricaSouth AsiaSouth Asia (IDA & IBRD)South SudanSpainSri LankaSt. Kitts and NevisSt. LuciaSt. Vincent and the GrenadinesSub-Saharan Africa Sub-Saharan Africa (excluding high income)Sub-Saharan Africa (IDA & IBRD countries)SudanSurinameSwazilandSwedenSwitzerlandSyrian Arab RepublicTajikistanTanzaniaThailandTimor-LesteTogoTongaTrinidad and TobagoTunisiaTurkeyTurkmenistanUgandaUkraineUnited Arab EmiratesUnited KingdomUnited StatesUpper middle incomeUruguayUzbekistanVanuatuVenezuela, RBVietnamWest Bank and GazaWorldYemen, Rep.ZambiaZimbabwe Timeline:
This timeline shows a graph from 1961 to 2016 of Fiji. No data until 1960. Number of actual observations by date: 56.
Source name:
World Development Indicators
Source organization:
World Bank national accounts data, and OECD National Accounts data files.
Categories, topics:
Economy & Growth, Trade
Last updated:
apr 23, 2017
Indicators value changes by year
Minimum:
71.475
jan 1, 1962
Maximum:
135.422
jan 1, 2001
At the date of observation
Value
Absolute change
Change from previous value
jan 1, 1961
78.027
+78.027
0.0%
jan 1, 1962
71.475
-6.552
-8.4%
jan 1, 1963
74.488
+3.013
4.22%
jan 1, 1964
99.708
+25.22
33.86%
jan 1, 1965
106.025
+6.317
6.34%
jan 1, 1966
100.514
-5.511
-5.2%
jan 1, 1967
91.395
-9.119
-9.07%
jan 1, 1968
91.82
+0.424
0.46%
jan 1, 1969
99.246
+7.426
8.09%
jan 1, 1970
103.39
+4.144
4.18%
jan 1, 1971
100.0
-3.39
-3.28%
jan 1, 1972
107.362
+7.362
7.36%
jan 1, 1973
101.072
-6.29
-5.86%
jan 1, 1974
104.05
+2.978
2.95%
jan 1, 1975
103.489
-0.561
-0.54%
jan 1, 1976
86.629
-16.86
-16.29%
jan 1, 1977
80.144
-6.484
-7.49%
jan 1, 1978
90.592
+10.448
13.04%
jan 1, 1979
89.718
-0.874
-0.97%
jan 1, 1980
95.975
+6.257
6.97%
jan 1, 1981
100.498
+4.523
4.71%
jan 1, 1982
100.454
-0.044
-0.04%
jan 1, 1983
92.868
-7.586
-7.55%
jan 1, 1984
92.646
-0.222
-0.24%
jan 1, 1985
86.725
-5.921
-6.39%
jan 1, 1986
89.1
+2.375
2.74%
jan 1, 1987
81.138
-7.961
-8.94%
jan 1, 1988
87.36
+6.222
7.67%
jan 1, 1989
105.442
+18.082
20.7%
jan 1, 1990
123.025
+17.583
16.68%
jan 1, 1991
129.5
+6.475
5.26%
jan 1, 1992
117.816
-11.684
-9.02%
jan 1, 1993
106.832
-10.984
-9.32%
jan 1, 1994
111.826
+4.994
4.67%
jan 1, 1995
115.873
+4.047
3.62%
jan 1, 1996
118.139
+2.265
1.95%
jan 1, 1997
121.693
+3.555
3.01%
jan 1, 1998
119.48
-2.213
-1.82%
jan 1, 1999
119.109
-0.371
-0.31%
jan 1, 2000
122.443
+3.334
2.8%
jan 1, 2001
135.422
+12.979
10.6%
jan 1, 2002
129.399
-6.023
-4.45%
jan 1, 2003
125.409
-3.99
-3.08%
jan 1, 2004
128.114
+2.705
2.16%
jan 1, 2005
124.231
-3.883
-3.03%
jan 1, 2006
118.251
-5.98
-4.81%
jan 1, 2007
117.822
-0.429
-0.36%
jan 1, 2008
110.634
-7.188
-6.1%
jan 1, 2009
130.72
+20.087
18.16%
jan 1, 2010
109.252
-21.468
-16.42%
jan 1, 2011
121.731
+12.479
11.42%
jan 1, 2012
124.195
+2.464
2.02%
jan 1, 2013
125.284
+1.09
0.88%
jan 1, 2014
126.153
+0.868
0.69%
jan 1, 2015
119.232
-6.92
-5.49%
jan 1, 2016
110.056
-9.177
-7.7%
Ranking of countries by current statistics by years


Comments: