29
/
en
AIzaSyAYiBZKx7MnpbEhh9jyipgxe19OcubqV5w
April 1, 2024
116294
Cuba
CUB
true
2
1
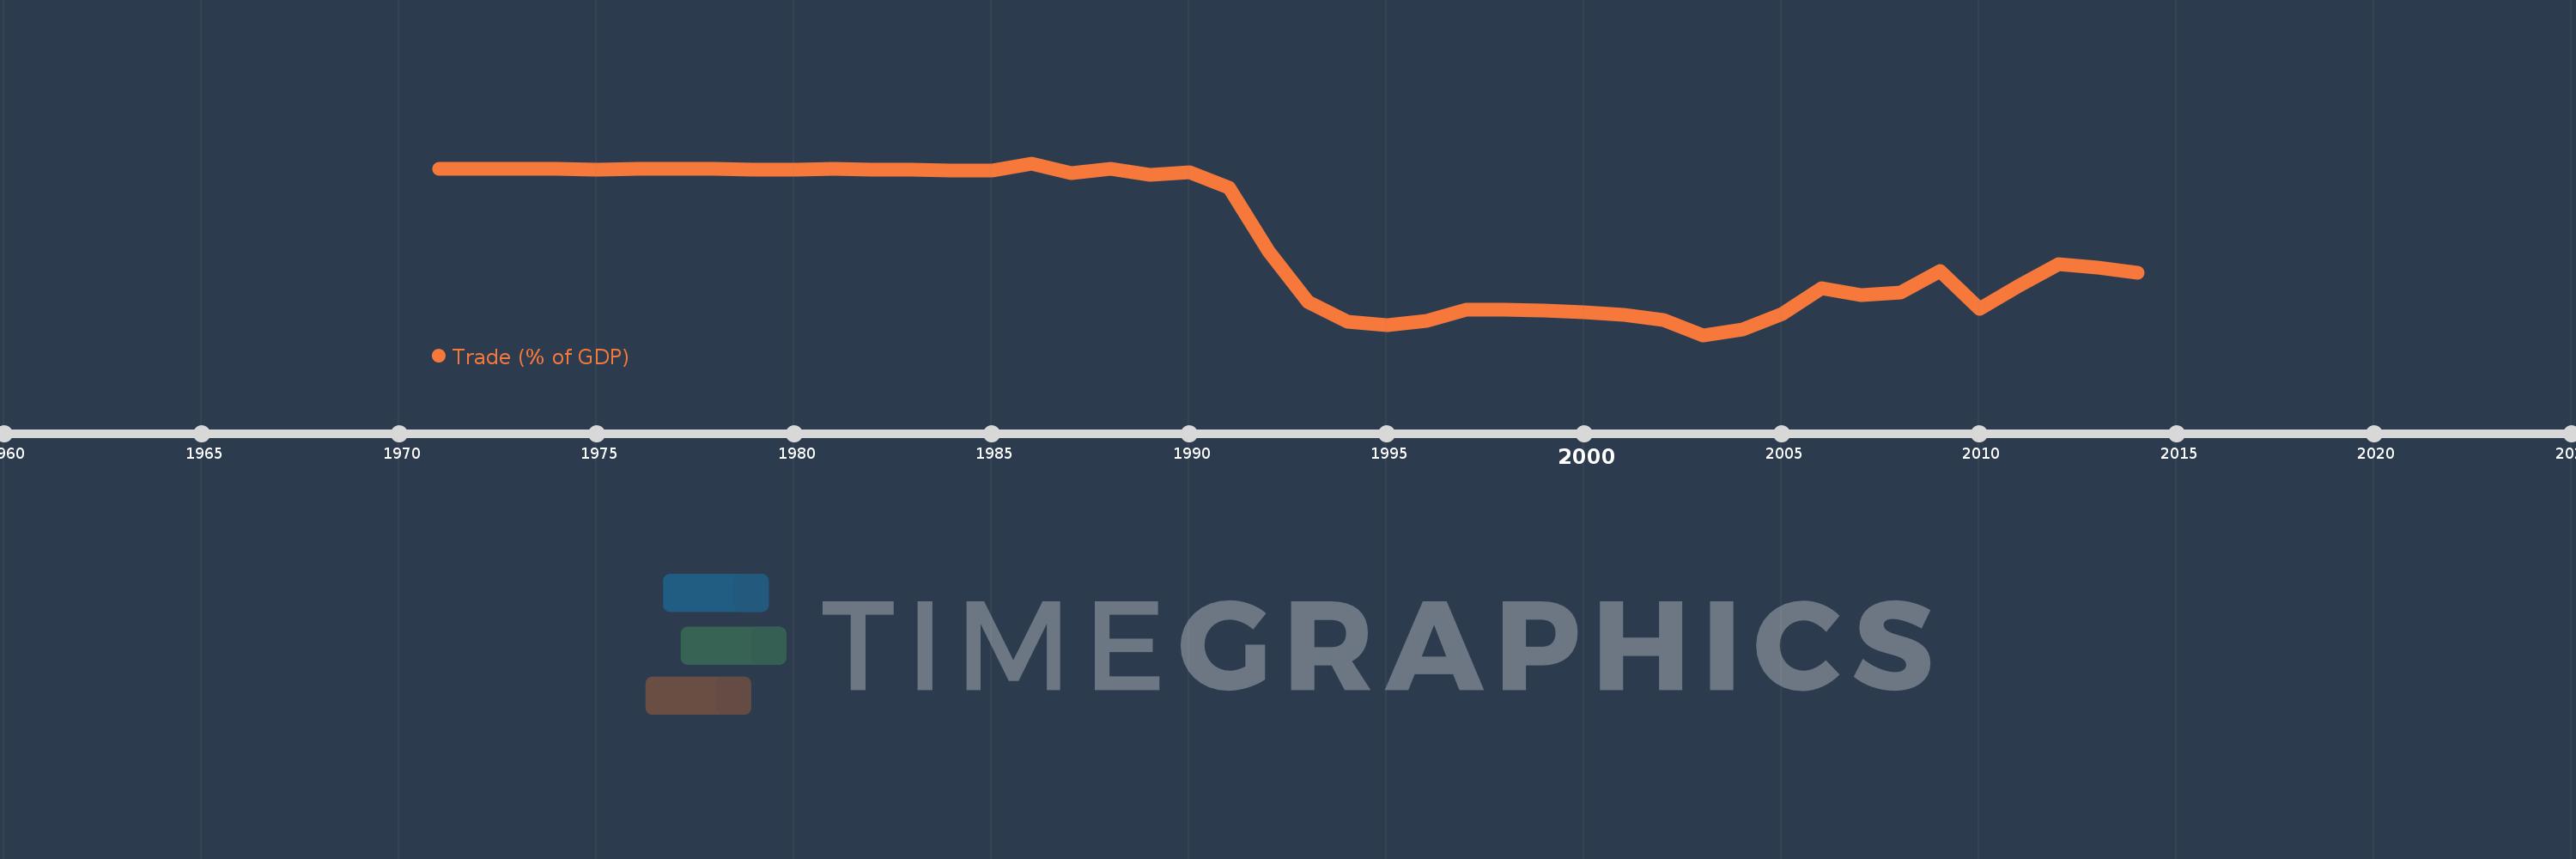
Trade (% of GDP)
2014,2013,2012,2011,2010,2009,2008,2007,2006,2005,2004,2003,2002,2001,2000,1999,1998,1997,1996,1995,1994,1993,1992,1991,1990,1989,1988,1987,1986,1985,1984,1983,1982,1981,1980,1979,1978,1977,1976,1975,1974,1973,1972,1971
This statistics in other country:
AfghanistanAlbaniaAlgeriaAngolaAntigua and BarbudaArab WorldArgentinaArmeniaArubaAustraliaAustriaAzerbaijanBahamas, TheBahrainBangladeshBarbadosBelarusBelgiumBelizeBeninBermudaBhutanBoliviaBosnia and HerzegovinaBotswanaBrazilBrunei DarussalamBulgariaBurkina FasoBurundiCabo VerdeCambodiaCameroonCanadaCaribbean small statesCentral African RepublicCentral Europe and the BalticsChadChileChinaColombiaComorosCongo, Dem. Rep.Congo, Rep.Costa RicaCote d'IvoireCroatiaCubaCyprusCzech RepublicDenmarkDjiboutiDominicaDominican RepublicEarly-demographic dividendEast Asia & PacificEast Asia & Pacific (excluding high income)East Asia & Pacific (IDA & IBRD countries)EcuadorEgypt, Arab Rep.El SalvadorEquatorial GuineaEritreaEstoniaEthiopiaEuro areaEurope & Central AsiaEurope & Central Asia (excluding high income)Europe & Central Asia (IDA & IBRD countries)European UnionFaroe IslandsFijiFinlandFragile and conflict affected situationsFranceFrench PolynesiaGabonGambia, TheGeorgiaGermanyGhanaGreeceGrenadaGuatemalaGuineaGuinea-BissauGuyanaHaitiHeavily indebted poor countries (HIPC)High incomeHondurasHong Kong SAR, ChinaHungaryIBRD onlyIcelandIDA & IBRD totalIDA blendIDA onlyIDA totalIndiaIndonesiaIran, Islamic Rep.IraqIrelandIsraelItalyJamaicaJapanJordanKazakhstanKenyaKiribatiKorea, Rep.KosovoKuwaitKyrgyz RepublicLao PDRLate-demographic dividendLatin America & Caribbean Latin America & Caribbean (excluding high income)Latin America & the Caribbean (IDA & IBRD countries)LatviaLeast developed countries: UN classificationLebanonLesothoLiberiaLibyaLithuaniaLow & middle incomeLow incomeLower middle incomeLuxembourgMacao SAR, ChinaMacedonia, FYRMadagascarMalawiMalaysiaMaldivesMaliMaltaMauritaniaMauritiusMexicoMicronesia, Fed. Sts.Middle East & North AfricaMiddle East & North Africa (excluding high income)Middle East & North Africa (IDA & IBRD countries)Middle incomeMoldovaMongoliaMontenegroMoroccoMozambiqueMyanmarNamibiaNepalNetherlandsNew CaledoniaNew ZealandNicaraguaNigerNigeriaNorth AmericaNorwayOECD membersOmanOther small statesPacific island small statesPakistanPalauPanamaPapua New GuineaParaguayPeruPhilippinesPolandPortugalPost-demographic dividendPre-demographic dividendPuerto RicoQatarRomaniaRussian FederationRwandaSamoaSaudi ArabiaSenegalSerbiaSeychellesSierra LeoneSingaporeSlovak RepublicSloveniaSmall statesSolomon IslandsSomaliaSouth AfricaSouth AsiaSouth Asia (IDA & IBRD)South SudanSpainSri LankaSt. Kitts and NevisSt. LuciaSt. Vincent and the GrenadinesSub-Saharan Africa Sub-Saharan Africa (excluding high income)Sub-Saharan Africa (IDA & IBRD countries)SudanSurinameSwazilandSwedenSwitzerlandSyrian Arab RepublicTajikistanTanzaniaThailandTimor-LesteTogoTongaTrinidad and TobagoTunisiaTurkeyTurkmenistanUgandaUkraineUnited Arab EmiratesUnited KingdomUnited StatesUpper middle incomeUruguayUzbekistanVanuatuVenezuela, RBVietnamWest Bank and GazaWorldYemen, Rep.ZambiaZimbabwe Timeline:
This timeline shows a graph from 1971 to 2014 of Cuba. No data until 1970. Number of actual observations by date: 44.
Source name:
World Development Indicators
Source organization:
World Bank national accounts data, and OECD National Accounts data files.
Categories, topics:
Economy & Growth, Trade
Last updated:
apr 23, 2017
Indicators value changes by year
Minimum:
24.729
jan 1, 2003
Maximum:
78.677
jan 1, 1986
At the date of observation
Value
Absolute change
Change from previous value
jan 1, 1971
76.807
+76.807
0.0%
jan 1, 1972
76.809
+0.002
0.0%
jan 1, 1973
76.809
+0.001
0.0%
jan 1, 1974
76.802
-0.008
-0.01%
jan 1, 1975
76.786
-0.016
-0.02%
jan 1, 1976
76.827
+0.041
0.05%
jan 1, 1977
76.819
-0.008
-0.01%
jan 1, 1978
76.814
-0.005
-0.01%
jan 1, 1979
76.763
-0.05
-0.07%
jan 1, 1980
76.705
-0.058
-0.08%
jan 1, 1981
77.034
+0.329
0.43%
jan 1, 1982
76.78
-0.254
-0.33%
jan 1, 1983
76.786
+0.006
0.01%
jan 1, 1984
76.511
-0.275
-0.36%
jan 1, 1985
76.414
-0.097
-0.13%
jan 1, 1986
78.677
+2.263
2.96%
jan 1, 1987
75.512
-3.165
-4.02%
jan 1, 1988
76.817
+1.306
1.73%
jan 1, 1989
75.137
-1.68
-2.19%
jan 1, 1990
75.929
+0.792
1.05%
jan 1, 1991
71.114
-4.814
-6.34%
jan 1, 1992
50.996
-20.118
-28.29%
jan 1, 1993
35.147
-15.849
-31.08%
jan 1, 1994
28.916
-6.231
-17.73%
jan 1, 1995
27.776
-1.14
-3.94%
jan 1, 1996
29.308
+1.533
5.52%
jan 1, 1997
32.625
+3.317
11.32%
jan 1, 1998
32.755
+0.13
0.4%
jan 1, 1999
32.504
-0.25
-0.76%
jan 1, 2000
31.868
-0.636
-1.96%
jan 1, 2001
31.076
-0.792
-2.49%
jan 1, 2002
29.362
-1.715
-5.52%
jan 1, 2003
24.729
-4.632
-15.78%
jan 1, 2004
26.587
+1.858
7.51%
jan 1, 2005
31.312
+4.725
17.77%
jan 1, 2006
39.362
+8.05
25.71%
jan 1, 2007
37.188
-2.174
-5.52%
jan 1, 2008
37.968
+0.78
2.1%
jan 1, 2009
44.917
+6.949
18.3%
jan 1, 2010
32.914
-12.004
-26.72%
jan 1, 2011
40.293
+7.379
22.42%
jan 1, 2012
46.96
+6.668
16.55%
jan 1, 2013
45.868
-1.093
-2.33%
jan 1, 2014
44.323
-1.545
-3.37%
Ranking of countries by current statistics by years


Comments: