29
/
en
AIzaSyAYiBZKx7MnpbEhh9jyipgxe19OcubqV5w
April 1, 2024
183389
Macao SAR, China
MAC
true
2
1
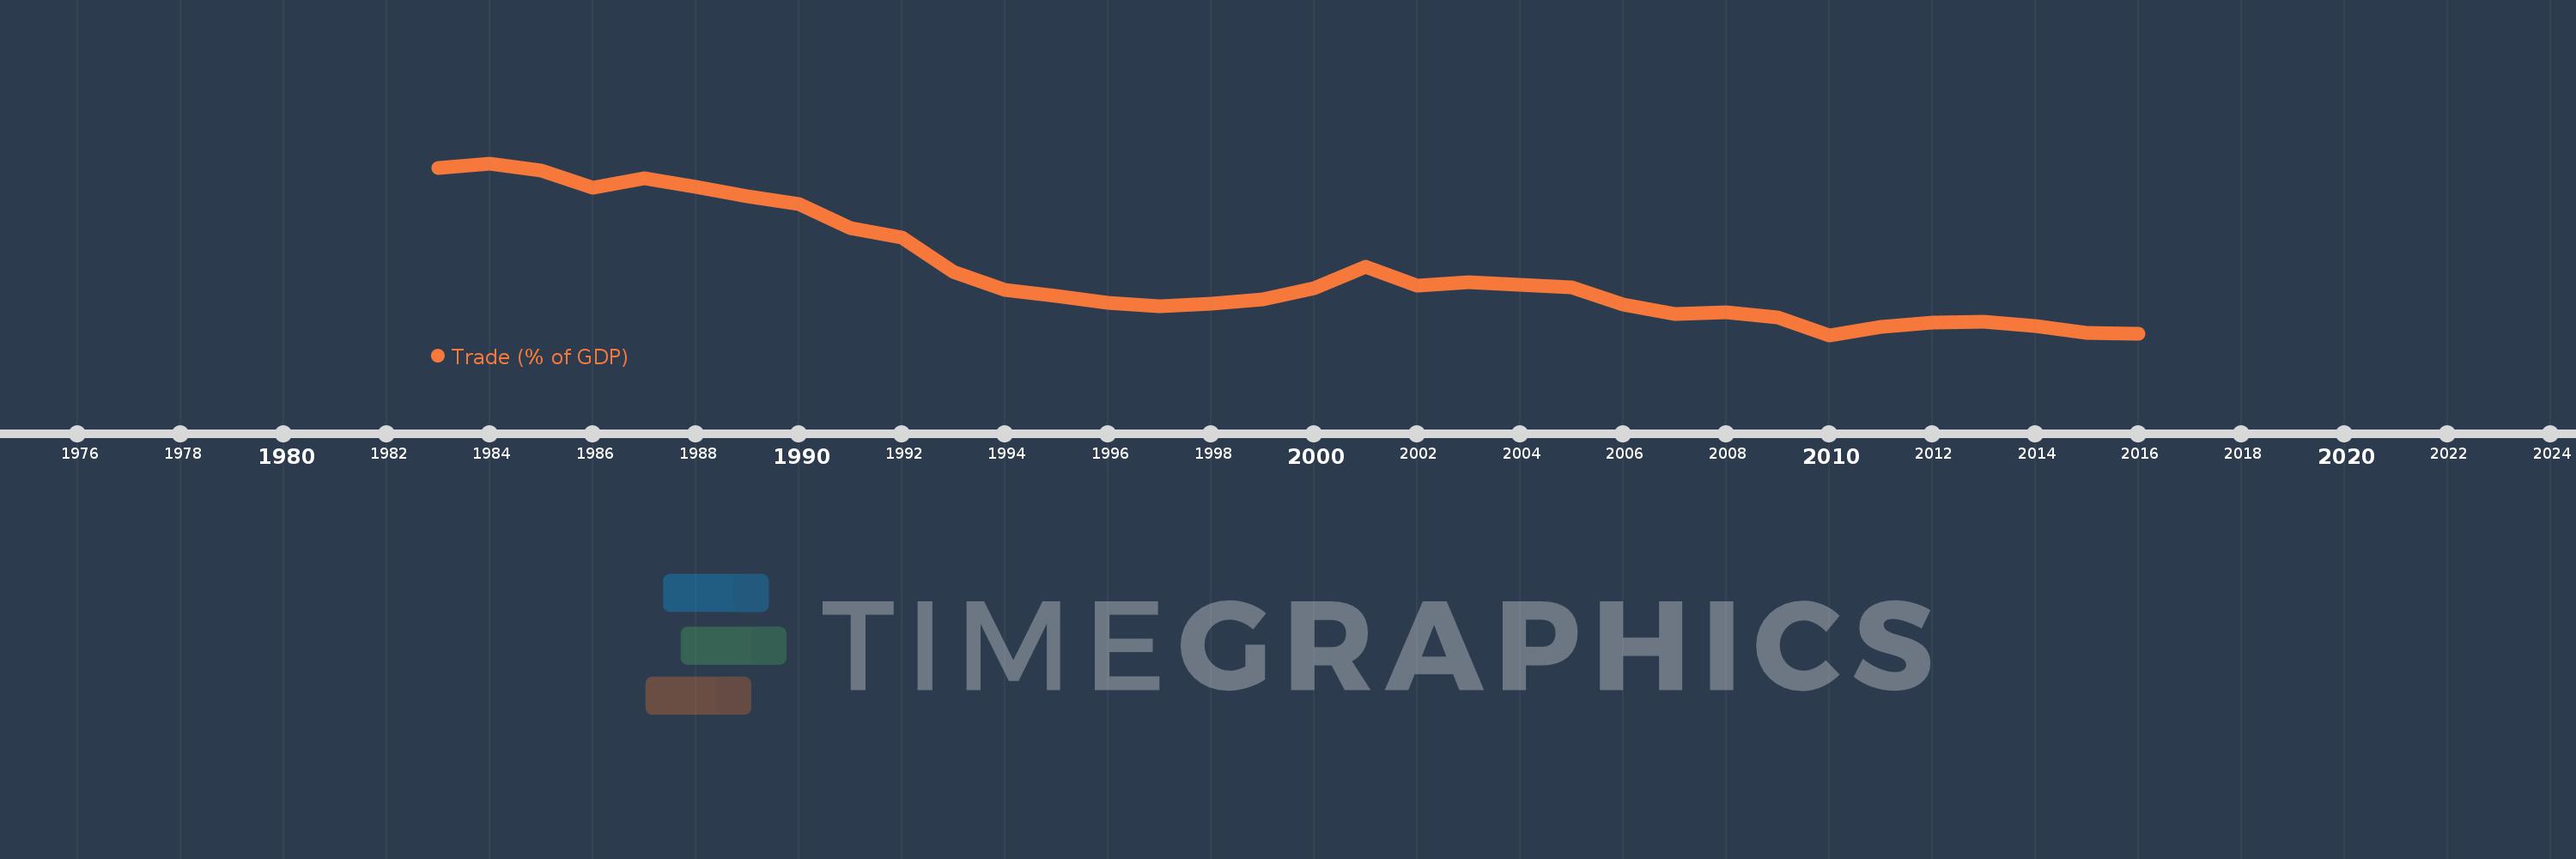
Trade (% of GDP)
2016,2015,2014,2013,2012,2011,2010,2009,2008,2007,2006,2005,2004,2003,2002,2001,2000,1999,1998,1997,1996,1995,1994,1993,1992,1991,1990,1989,1988,1987,1986,1985,1984,1983
This statistics in other country:
AfghanistanAlbaniaAlgeriaAngolaAntigua and BarbudaArab WorldArgentinaArmeniaArubaAustraliaAustriaAzerbaijanBahamas, TheBahrainBangladeshBarbadosBelarusBelgiumBelizeBeninBermudaBhutanBoliviaBosnia and HerzegovinaBotswanaBrazilBrunei DarussalamBulgariaBurkina FasoBurundiCabo VerdeCambodiaCameroonCanadaCaribbean small statesCentral African RepublicCentral Europe and the BalticsChadChileChinaColombiaComorosCongo, Dem. Rep.Congo, Rep.Costa RicaCote d'IvoireCroatiaCubaCyprusCzech RepublicDenmarkDjiboutiDominicaDominican RepublicEarly-demographic dividendEast Asia & PacificEast Asia & Pacific (excluding high income)East Asia & Pacific (IDA & IBRD countries)EcuadorEgypt, Arab Rep.El SalvadorEquatorial GuineaEritreaEstoniaEthiopiaEuro areaEurope & Central AsiaEurope & Central Asia (excluding high income)Europe & Central Asia (IDA & IBRD countries)European UnionFaroe IslandsFijiFinlandFragile and conflict affected situationsFranceFrench PolynesiaGabonGambia, TheGeorgiaGermanyGhanaGreeceGrenadaGuatemalaGuineaGuinea-BissauGuyanaHaitiHeavily indebted poor countries (HIPC)High incomeHondurasHong Kong SAR, ChinaHungaryIBRD onlyIcelandIDA & IBRD totalIDA blendIDA onlyIDA totalIndiaIndonesiaIran, Islamic Rep.IraqIrelandIsraelItalyJamaicaJapanJordanKazakhstanKenyaKiribatiKorea, Rep.KosovoKuwaitKyrgyz RepublicLao PDRLate-demographic dividendLatin America & Caribbean Latin America & Caribbean (excluding high income)Latin America & the Caribbean (IDA & IBRD countries)LatviaLeast developed countries: UN classificationLebanonLesothoLiberiaLibyaLithuaniaLow & middle incomeLow incomeLower middle incomeLuxembourgMacao SAR, ChinaMacedonia, FYRMadagascarMalawiMalaysiaMaldivesMaliMaltaMauritaniaMauritiusMexicoMicronesia, Fed. Sts.Middle East & North AfricaMiddle East & North Africa (excluding high income)Middle East & North Africa (IDA & IBRD countries)Middle incomeMoldovaMongoliaMontenegroMoroccoMozambiqueMyanmarNamibiaNepalNetherlandsNew CaledoniaNew ZealandNicaraguaNigerNigeriaNorth AmericaNorwayOECD membersOmanOther small statesPacific island small statesPakistanPalauPanamaPapua New GuineaParaguayPeruPhilippinesPolandPortugalPost-demographic dividendPre-demographic dividendPuerto RicoQatarRomaniaRussian FederationRwandaSamoaSaudi ArabiaSenegalSerbiaSeychellesSierra LeoneSingaporeSlovak RepublicSloveniaSmall statesSolomon IslandsSomaliaSouth AfricaSouth AsiaSouth Asia (IDA & IBRD)South SudanSpainSri LankaSt. Kitts and NevisSt. LuciaSt. Vincent and the GrenadinesSub-Saharan Africa Sub-Saharan Africa (excluding high income)Sub-Saharan Africa (IDA & IBRD countries)SudanSurinameSwazilandSwedenSwitzerlandSyrian Arab RepublicTajikistanTanzaniaThailandTimor-LesteTogoTongaTrinidad and TobagoTunisiaTurkeyTurkmenistanUgandaUkraineUnited Arab EmiratesUnited KingdomUnited StatesUpper middle incomeUruguayUzbekistanVanuatuVenezuela, RBVietnamWest Bank and GazaWorldYemen, Rep.ZambiaZimbabwe Timeline:
This timeline shows a graph from 1983 to 2016 of Macao SAR, China. No data until 1982. Number of actual observations by date: 34.
Source name:
World Development Indicators
Source organization:
World Bank national accounts data, and OECD National Accounts data files.
Categories, topics:
Economy & Growth, Trade
Last updated:
apr 23, 2017
Indicators value changes by year
Minimum:
114.148
jan 1, 2010
Maximum:
241.884
jan 1, 1984
At the date of observation
Value
Absolute change
Change from previous value
jan 1, 1983
238.313
+238.313
0.0%
jan 1, 1984
241.884
+3.571
1.5%
jan 1, 1985
236.283
-5.601
-2.32%
jan 1, 1986
223.712
-12.571
-5.32%
jan 1, 1987
231.025
+7.313
3.27%
jan 1, 1988
224.056
-6.969
-3.02%
jan 1, 1989
217.435
-6.621
-2.95%
jan 1, 1990
211.479
-5.956
-2.74%
jan 1, 1991
193.94
-17.539
-8.29%
jan 1, 1992
186.47
-7.47
-3.85%
jan 1, 1993
161.05
-25.421
-13.63%
jan 1, 1994
147.585
-13.465
-8.36%
jan 1, 1995
143.381
-4.203
-2.85%
jan 1, 1996
137.914
-5.467
-3.81%
jan 1, 1997
135.833
-2.081
-1.51%
jan 1, 1998
137.535
+1.702
1.25%
jan 1, 1999
140.446
+2.911
2.12%
jan 1, 2000
148.73
+8.283
5.9%
jan 1, 2001
165.054
+16.324
10.98%
jan 1, 2002
151.103
-13.95
-8.45%
jan 1, 2003
153.403
+2.3
1.52%
jan 1, 2004
151.738
-1.665
-1.09%
jan 1, 2005
149.715
-2.023
-1.33%
jan 1, 2006
137.136
-12.579
-8.4%
jan 1, 2007
129.521
-7.615
-5.55%
jan 1, 2008
131.379
+1.857
1.43%
jan 1, 2009
127.27
-4.108
-3.13%
jan 1, 2010
114.148
-13.122
-10.31%
jan 1, 2011
120.444
+6.296
5.52%
jan 1, 2012
123.344
+2.9
2.41%
jan 1, 2013
124.169
+0.825
0.67%
jan 1, 2014
121.042
-3.127
-2.52%
jan 1, 2015
115.975
-5.067
-4.19%
jan 1, 2016
114.92
-1.055
-0.91%
Ranking of countries by current statistics by years


Comments: