29
/
en
AIzaSyAYiBZKx7MnpbEhh9jyipgxe19OcubqV5w
April 1, 2024
151209
Honduras
HND
true
2
1
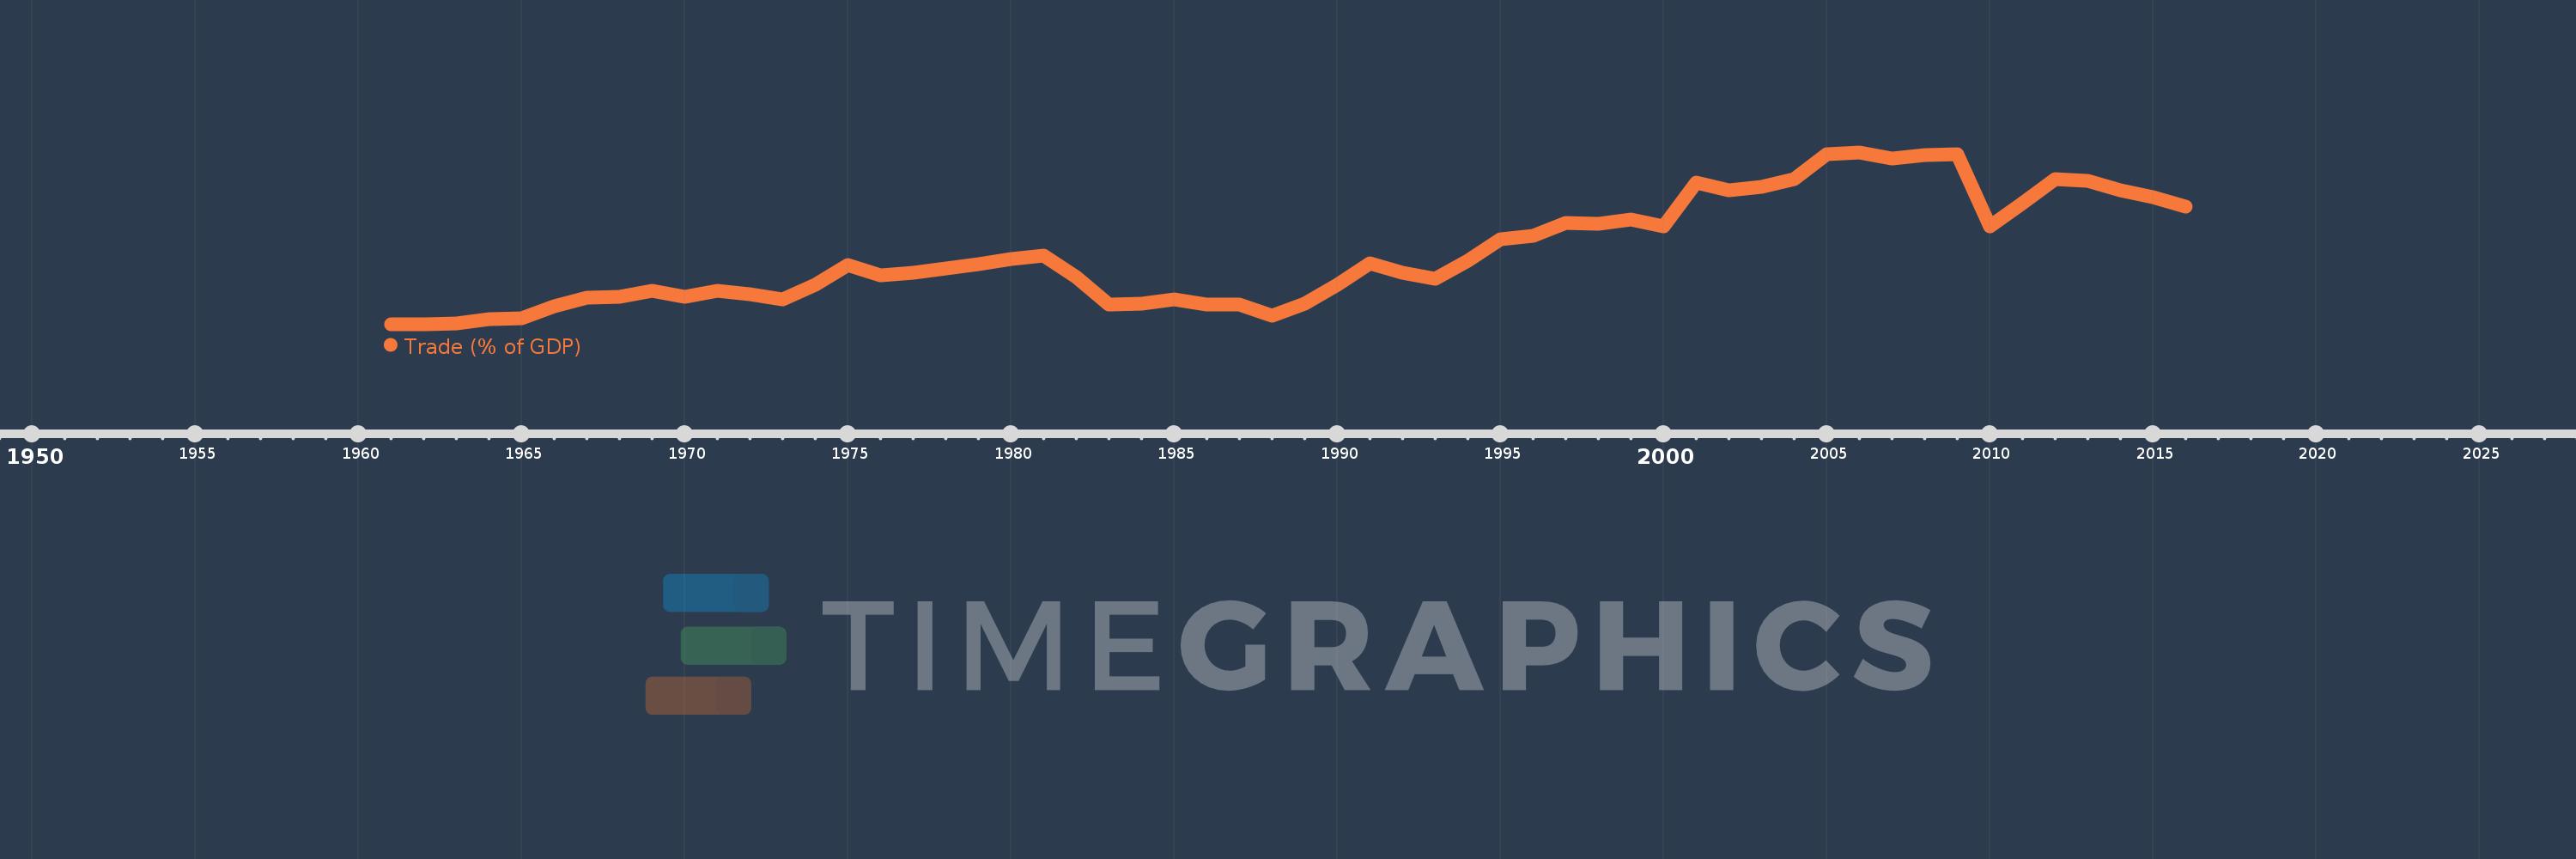
Trade (% of GDP)
2016,2015,2014,2013,2012,2011,2010,2009,2008,2007,2006,2005,2004,2003,2002,2001,2000,1999,1998,1997,1996,1995,1994,1993,1992,1991,1990,1989,1988,1987,1986,1985,1984,1983,1982,1981,1980,1979,1978,1977,1976,1975,1974,1973,1972,1971,1970,1969,1968,1967,1966,1965,1964,1963,1962,1961
This statistics in other country:
AfghanistanAlbaniaAlgeriaAngolaAntigua and BarbudaArab WorldArgentinaArmeniaArubaAustraliaAustriaAzerbaijanBahamas, TheBahrainBangladeshBarbadosBelarusBelgiumBelizeBeninBermudaBhutanBoliviaBosnia and HerzegovinaBotswanaBrazilBrunei DarussalamBulgariaBurkina FasoBurundiCabo VerdeCambodiaCameroonCanadaCaribbean small statesCentral African RepublicCentral Europe and the BalticsChadChileChinaColombiaComorosCongo, Dem. Rep.Congo, Rep.Costa RicaCote d'IvoireCroatiaCubaCyprusCzech RepublicDenmarkDjiboutiDominicaDominican RepublicEarly-demographic dividendEast Asia & PacificEast Asia & Pacific (excluding high income)East Asia & Pacific (IDA & IBRD countries)EcuadorEgypt, Arab Rep.El SalvadorEquatorial GuineaEritreaEstoniaEthiopiaEuro areaEurope & Central AsiaEurope & Central Asia (excluding high income)Europe & Central Asia (IDA & IBRD countries)European UnionFaroe IslandsFijiFinlandFragile and conflict affected situationsFranceFrench PolynesiaGabonGambia, TheGeorgiaGermanyGhanaGreeceGrenadaGuatemalaGuineaGuinea-BissauGuyanaHaitiHeavily indebted poor countries (HIPC)High incomeHondurasHong Kong SAR, ChinaHungaryIBRD onlyIcelandIDA & IBRD totalIDA blendIDA onlyIDA totalIndiaIndonesiaIran, Islamic Rep.IraqIrelandIsraelItalyJamaicaJapanJordanKazakhstanKenyaKiribatiKorea, Rep.KosovoKuwaitKyrgyz RepublicLao PDRLate-demographic dividendLatin America & Caribbean Latin America & Caribbean (excluding high income)Latin America & the Caribbean (IDA & IBRD countries)LatviaLeast developed countries: UN classificationLebanonLesothoLiberiaLibyaLithuaniaLow & middle incomeLow incomeLower middle incomeLuxembourgMacao SAR, ChinaMacedonia, FYRMadagascarMalawiMalaysiaMaldivesMaliMaltaMauritaniaMauritiusMexicoMicronesia, Fed. Sts.Middle East & North AfricaMiddle East & North Africa (excluding high income)Middle East & North Africa (IDA & IBRD countries)Middle incomeMoldovaMongoliaMontenegroMoroccoMozambiqueMyanmarNamibiaNepalNetherlandsNew CaledoniaNew ZealandNicaraguaNigerNigeriaNorth AmericaNorwayOECD membersOmanOther small statesPacific island small statesPakistanPalauPanamaPapua New GuineaParaguayPeruPhilippinesPolandPortugalPost-demographic dividendPre-demographic dividendPuerto RicoQatarRomaniaRussian FederationRwandaSamoaSaudi ArabiaSenegalSerbiaSeychellesSierra LeoneSingaporeSlovak RepublicSloveniaSmall statesSolomon IslandsSomaliaSouth AfricaSouth AsiaSouth Asia (IDA & IBRD)South SudanSpainSri LankaSt. Kitts and NevisSt. LuciaSt. Vincent and the GrenadinesSub-Saharan Africa Sub-Saharan Africa (excluding high income)Sub-Saharan Africa (IDA & IBRD countries)SudanSurinameSwazilandSwedenSwitzerlandSyrian Arab RepublicTajikistanTanzaniaThailandTimor-LesteTogoTongaTrinidad and TobagoTunisiaTurkeyTurkmenistanUgandaUkraineUnited Arab EmiratesUnited KingdomUnited StatesUpper middle incomeUruguayUzbekistanVanuatuVenezuela, RBVietnamWest Bank and GazaWorldYemen, Rep.ZambiaZimbabwe Timeline:
This timeline shows a graph from 1961 to 2016 of Honduras. No data until 1960. Number of actual observations by date: 56.
Source name:
World Development Indicators
Source organization:
World Bank national accounts data, and OECD National Accounts data files.
Categories, topics:
Economy & Growth, Trade
Last updated:
apr 23, 2017
Indicators value changes by year
Minimum:
44.245
jan 1, 1962
Maximum:
136.49
jan 1, 2006
At the date of observation
Value
Absolute change
Change from previous value
jan 1, 1961
44.421
+44.421
0.0%
jan 1, 1962
44.245
-0.176
-0.4%
jan 1, 1963
44.565
+0.32
0.72%
jan 1, 1964
46.806
+2.242
5.03%
jan 1, 1965
47.221
+0.415
0.89%
jan 1, 1966
54.084
+6.863
14.53%
jan 1, 1967
58.696
+4.612
8.53%
jan 1, 1968
59.07
+0.374
0.64%
jan 1, 1969
62.028
+2.958
5.01%
jan 1, 1970
58.847
-3.181
-5.13%
jan 1, 1971
62.019
+3.172
5.39%
jan 1, 1972
60.192
-1.828
-2.95%
jan 1, 1973
57.472
-2.72
-4.52%
jan 1, 1974
65.315
+7.843
13.65%
jan 1, 1975
76.22
+10.905
16.7%
jan 1, 1976
70.374
-5.847
-7.67%
jan 1, 1977
71.884
+1.511
2.15%
jan 1, 1978
74.094
+2.21
3.07%
jan 1, 1979
76.471
+2.377
3.21%
jan 1, 1980
79.058
+2.588
3.38%
jan 1, 1981
81.294
+2.235
2.83%
jan 1, 1982
69.339
-11.955
-14.71%
jan 1, 1983
54.727
-14.611
-21.07%
jan 1, 1984
55.395
+0.668
1.22%
jan 1, 1985
57.728
+2.333
4.21%
jan 1, 1986
54.966
-2.762
-4.78%
jan 1, 1987
54.89
-0.076
-0.14%
jan 1, 1988
48.79
-6.1
-11.11%
jan 1, 1989
55.216
+6.426
13.17%
jan 1, 1990
65.347
+10.132
18.35%
jan 1, 1991
77.148
+11.8
18.06%
jan 1, 1992
72.098
-5.05
-6.55%
jan 1, 1993
68.447
-3.651
-5.06%
jan 1, 1994
78.386
+9.939
14.52%
jan 1, 1995
89.699
+11.313
14.43%
jan 1, 1996
91.778
+2.078
2.32%
jan 1, 1997
98.819
+7.042
7.67%
jan 1, 1998
98.004
-0.815
-0.82%
jan 1, 1999
100.501
+2.497
2.55%
jan 1, 2000
97.001
-3.5
-3.48%
jan 1, 2001
120.392
+23.391
24.11%
jan 1, 2002
115.943
-4.449
-3.7%
jan 1, 2003
117.997
+2.054
1.77%
jan 1, 2004
122.248
+4.251
3.6%
jan 1, 2005
135.462
+13.213
10.81%
jan 1, 2006
136.49
+1.028
0.76%
jan 1, 2007
133.132
-3.358
-2.46%
jan 1, 2008
135.071
+1.939
1.46%
jan 1, 2009
135.749
+0.678
0.5%
jan 1, 2010
96.905
-38.844
-28.61%
jan 1, 2011
109.442
+12.537
12.94%
jan 1, 2012
122.217
+12.775
11.67%
jan 1, 2013
121.188
-1.029
-0.84%
jan 1, 2014
116.306
-4.882
-4.03%
jan 1, 2015
112.609
-3.697
-3.18%
jan 1, 2016
107.435
-5.174
-4.59%
Ranking of countries by current statistics by years


Comments: