29
/
en
AIzaSyAYiBZKx7MnpbEhh9jyipgxe19OcubqV5w
April 1, 2024
168314
Kenya
KEN
true
2
1
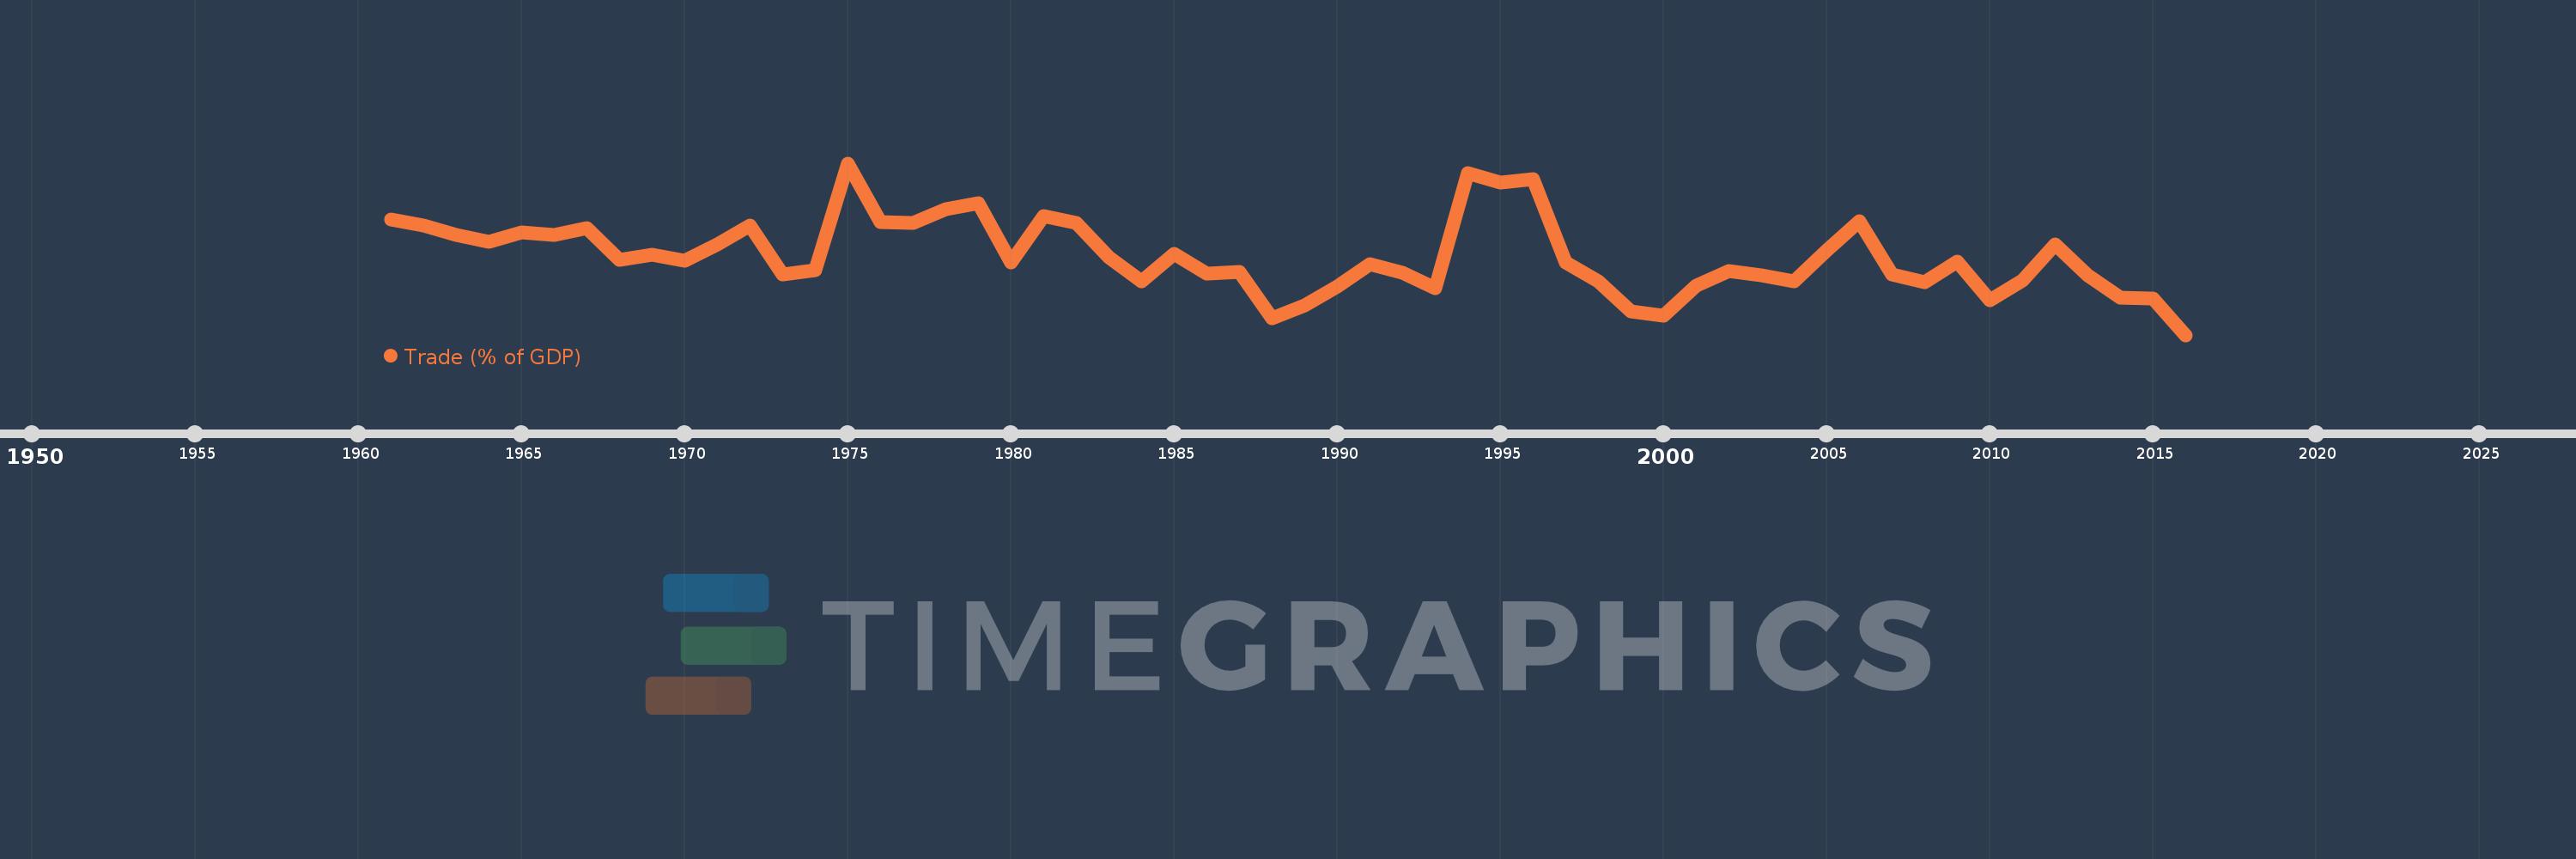
Trade (% of GDP)
2016,2015,2014,2013,2012,2011,2010,2009,2008,2007,2006,2005,2004,2003,2002,2001,2000,1999,1998,1997,1996,1995,1994,1993,1992,1991,1990,1989,1988,1987,1986,1985,1984,1983,1982,1981,1980,1979,1978,1977,1976,1975,1974,1973,1972,1971,1970,1969,1968,1967,1966,1965,1964,1963,1962,1961
This statistics in other country:
AfghanistanAlbaniaAlgeriaAngolaAntigua and BarbudaArab WorldArgentinaArmeniaArubaAustraliaAustriaAzerbaijanBahamas, TheBahrainBangladeshBarbadosBelarusBelgiumBelizeBeninBermudaBhutanBoliviaBosnia and HerzegovinaBotswanaBrazilBrunei DarussalamBulgariaBurkina FasoBurundiCabo VerdeCambodiaCameroonCanadaCaribbean small statesCentral African RepublicCentral Europe and the BalticsChadChileChinaColombiaComorosCongo, Dem. Rep.Congo, Rep.Costa RicaCote d'IvoireCroatiaCubaCyprusCzech RepublicDenmarkDjiboutiDominicaDominican RepublicEarly-demographic dividendEast Asia & PacificEast Asia & Pacific (excluding high income)East Asia & Pacific (IDA & IBRD countries)EcuadorEgypt, Arab Rep.El SalvadorEquatorial GuineaEritreaEstoniaEthiopiaEuro areaEurope & Central AsiaEurope & Central Asia (excluding high income)Europe & Central Asia (IDA & IBRD countries)European UnionFaroe IslandsFijiFinlandFragile and conflict affected situationsFranceFrench PolynesiaGabonGambia, TheGeorgiaGermanyGhanaGreeceGrenadaGuatemalaGuineaGuinea-BissauGuyanaHaitiHeavily indebted poor countries (HIPC)High incomeHondurasHong Kong SAR, ChinaHungaryIBRD onlyIcelandIDA & IBRD totalIDA blendIDA onlyIDA totalIndiaIndonesiaIran, Islamic Rep.IraqIrelandIsraelItalyJamaicaJapanJordanKazakhstanKenyaKiribatiKorea, Rep.KosovoKuwaitKyrgyz RepublicLao PDRLate-demographic dividendLatin America & Caribbean Latin America & Caribbean (excluding high income)Latin America & the Caribbean (IDA & IBRD countries)LatviaLeast developed countries: UN classificationLebanonLesothoLiberiaLibyaLithuaniaLow & middle incomeLow incomeLower middle incomeLuxembourgMacao SAR, ChinaMacedonia, FYRMadagascarMalawiMalaysiaMaldivesMaliMaltaMauritaniaMauritiusMexicoMicronesia, Fed. Sts.Middle East & North AfricaMiddle East & North Africa (excluding high income)Middle East & North Africa (IDA & IBRD countries)Middle incomeMoldovaMongoliaMontenegroMoroccoMozambiqueMyanmarNamibiaNepalNetherlandsNew CaledoniaNew ZealandNicaraguaNigerNigeriaNorth AmericaNorwayOECD membersOmanOther small statesPacific island small statesPakistanPalauPanamaPapua New GuineaParaguayPeruPhilippinesPolandPortugalPost-demographic dividendPre-demographic dividendPuerto RicoQatarRomaniaRussian FederationRwandaSamoaSaudi ArabiaSenegalSerbiaSeychellesSierra LeoneSingaporeSlovak RepublicSloveniaSmall statesSolomon IslandsSomaliaSouth AfricaSouth AsiaSouth Asia (IDA & IBRD)South SudanSpainSri LankaSt. Kitts and NevisSt. LuciaSt. Vincent and the GrenadinesSub-Saharan Africa Sub-Saharan Africa (excluding high income)Sub-Saharan Africa (IDA & IBRD countries)SudanSurinameSwazilandSwedenSwitzerlandSyrian Arab RepublicTajikistanTanzaniaThailandTimor-LesteTogoTongaTrinidad and TobagoTunisiaTurkeyTurkmenistanUgandaUkraineUnited Arab EmiratesUnited KingdomUnited StatesUpper middle incomeUruguayUzbekistanVanuatuVenezuela, RBVietnamWest Bank and GazaWorldYemen, Rep.ZambiaZimbabwe Timeline:
This timeline shows a graph from 1961 to 2016 of Kenya. No data until 1960. Number of actual observations by date: 56.
Source name:
World Development Indicators
Source organization:
World Bank national accounts data, and OECD National Accounts data files.
Categories, topics:
Economy & Growth, Trade
Last updated:
apr 23, 2017
Indicators value changes by year
Minimum:
44.807
jan 1, 2016
Maximum:
74.573
jan 1, 1975
At the date of observation
Value
Absolute change
Change from previous value
jan 1, 1961
64.766
+64.766
0.0%
jan 1, 1962
63.847
-0.919
-1.42%
jan 1, 1963
62.163
-1.684
-2.64%
jan 1, 1964
60.996
-1.167
-1.88%
jan 1, 1965
62.602
+1.606
2.63%
jan 1, 1966
62.093
-0.508
-0.81%
jan 1, 1967
63.284
+1.191
1.92%
jan 1, 1968
57.837
-5.447
-8.61%
jan 1, 1969
58.698
+0.861
1.49%
jan 1, 1970
57.617
-1.081
-1.84%
jan 1, 1971
60.49
+2.872
4.99%
jan 1, 1972
63.828
+3.339
5.52%
jan 1, 1973
55.315
-8.514
-13.34%
jan 1, 1974
56.063
+0.748
1.35%
jan 1, 1975
74.573
+18.511
33.02%
jan 1, 1976
64.335
-10.238
-13.73%
jan 1, 1977
64.206
-0.129
-0.2%
jan 1, 1978
66.552
+2.346
3.65%
jan 1, 1979
67.624
+1.072
1.61%
jan 1, 1980
57.364
-10.259
-15.17%
jan 1, 1981
65.417
+8.053
14.04%
jan 1, 1982
64.28
-1.137
-1.74%
jan 1, 1983
58.216
-6.064
-9.43%
jan 1, 1984
54.163
-4.053
-6.96%
jan 1, 1985
58.804
+4.641
8.57%
jan 1, 1986
55.445
-3.358
-5.71%
jan 1, 1987
55.741
+0.296
0.53%
jan 1, 1988
47.703
-8.039
-14.42%
jan 1, 1989
49.975
+2.272
4.76%
jan 1, 1990
53.156
+3.181
6.37%
jan 1, 1991
57.021
+3.865
7.27%
jan 1, 1992
55.598
-1.423
-2.5%
jan 1, 1993
52.931
-2.667
-4.8%
jan 1, 1994
72.858
+19.928
37.65%
jan 1, 1995
71.266
-1.592
-2.19%
jan 1, 1996
71.746
+0.48
0.67%
jan 1, 1997
57.312
-14.434
-20.12%
jan 1, 1998
54.057
-3.255
-5.68%
jan 1, 1999
48.897
-5.16
-9.55%
jan 1, 2000
48.192
-0.705
-1.44%
jan 1, 2001
53.309
+5.117
10.62%
jan 1, 2002
55.947
+2.638
4.95%
jan 1, 2003
55.173
-0.774
-1.38%
jan 1, 2004
54.132
-1.04
-1.89%
jan 1, 2005
59.477
+5.345
9.87%
jan 1, 2006
64.479
+5.002
8.41%
jan 1, 2007
55.236
-9.242
-14.33%
jan 1, 2008
53.895
-1.342
-2.43%
jan 1, 2009
57.579
+3.684
6.84%
jan 1, 2010
50.864
-6.715
-11.66%
jan 1, 2011
54.227
+3.364
6.61%
jan 1, 2012
60.449
+6.221
11.47%
jan 1, 2013
55.222
-5.227
-8.65%
jan 1, 2014
51.28
-3.942
-7.14%
jan 1, 2015
51.125
-0.155
-0.3%
jan 1, 2016
44.807
-6.318
-12.36%
Ranking of countries by current statistics by years


Comments: