29
/
en
AIzaSyAYiBZKx7MnpbEhh9jyipgxe19OcubqV5w
April 1, 2024
143655
Grenada
GRD
true
2
1
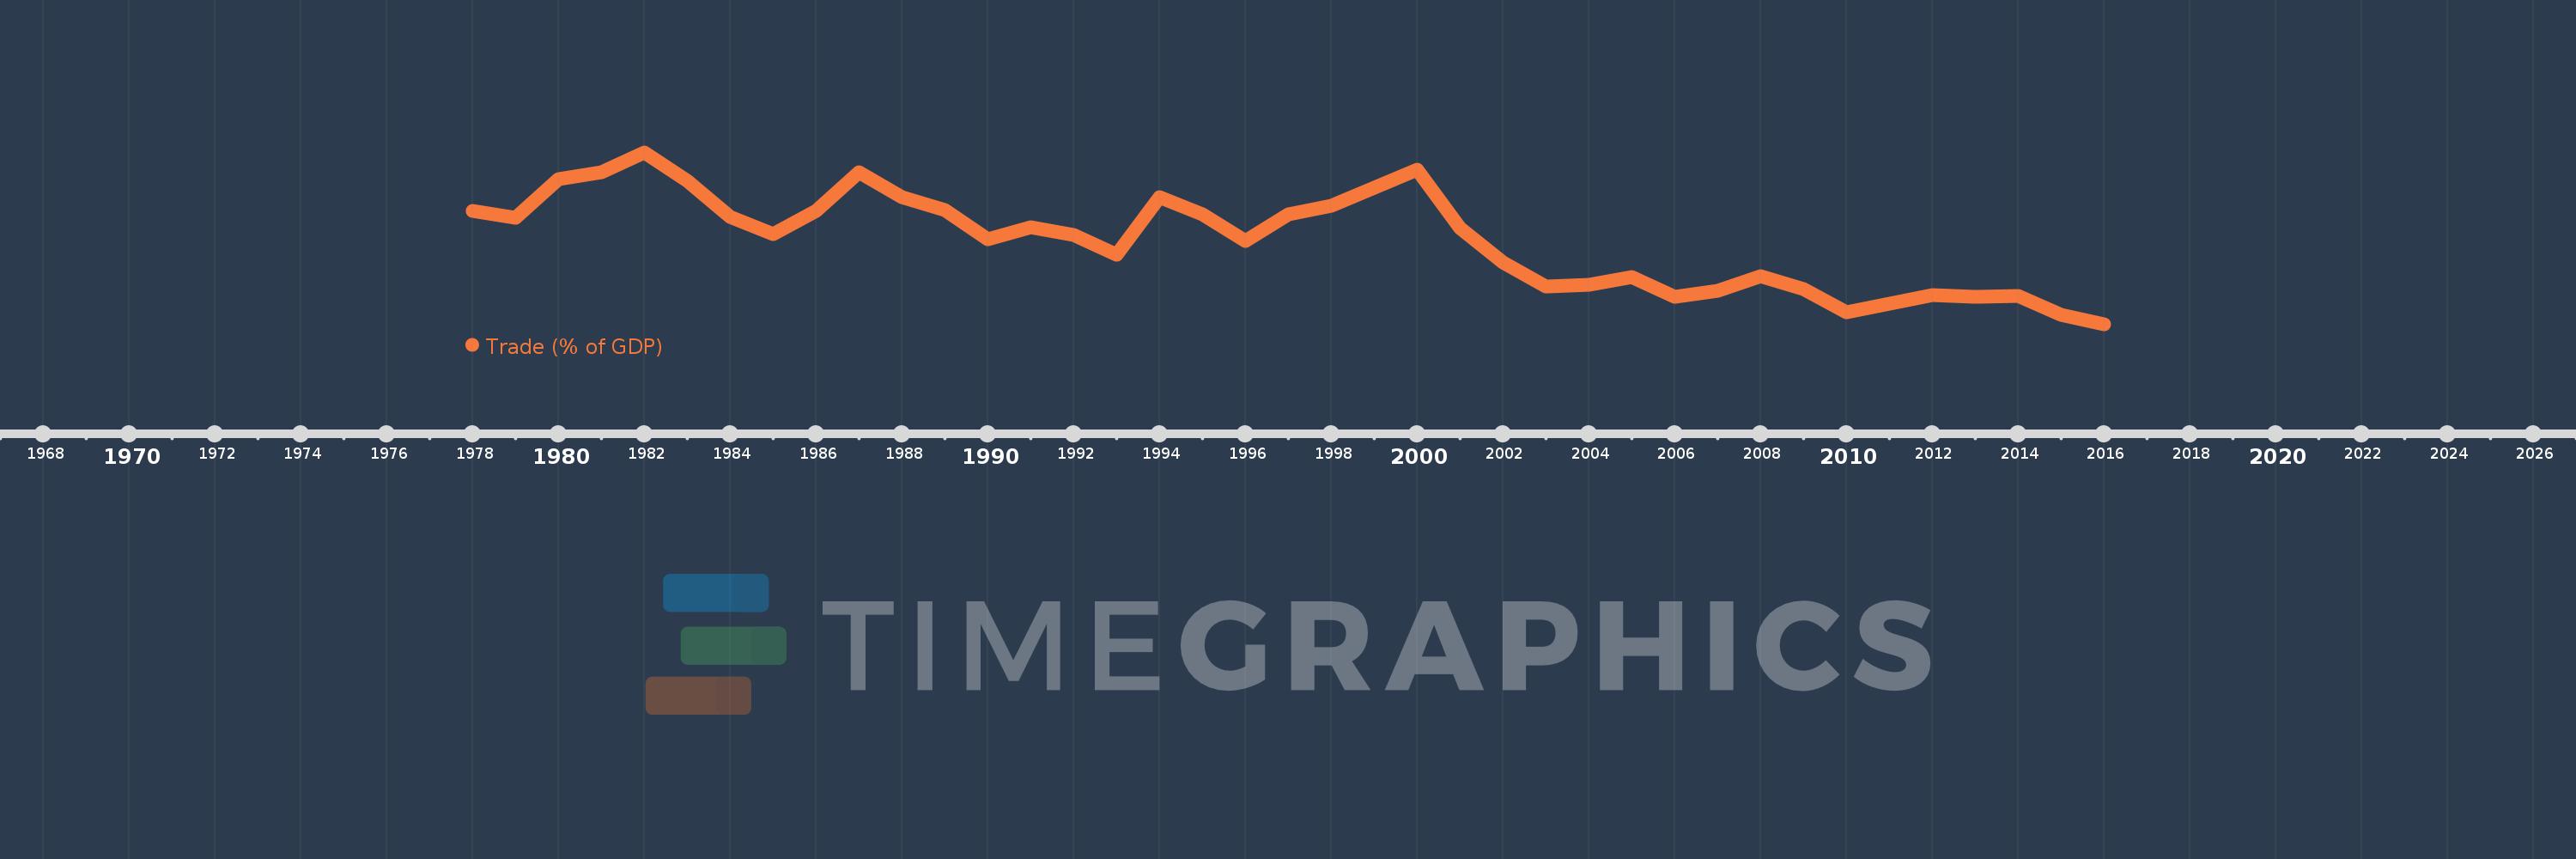
Trade (% of GDP)
2016,2015,2014,2013,2012,2011,2010,2009,2008,2007,2006,2005,2004,2003,2002,2001,2000,1999,1998,1997,1996,1995,1994,1993,1992,1991,1990,1989,1988,1987,1986,1985,1984,1983,1982,1981,1980,1979,1978
This statistics in other country:
AfghanistanAlbaniaAlgeriaAngolaAntigua and BarbudaArab WorldArgentinaArmeniaArubaAustraliaAustriaAzerbaijanBahamas, TheBahrainBangladeshBarbadosBelarusBelgiumBelizeBeninBermudaBhutanBoliviaBosnia and HerzegovinaBotswanaBrazilBrunei DarussalamBulgariaBurkina FasoBurundiCabo VerdeCambodiaCameroonCanadaCaribbean small statesCentral African RepublicCentral Europe and the BalticsChadChileChinaColombiaComorosCongo, Dem. Rep.Congo, Rep.Costa RicaCote d'IvoireCroatiaCubaCyprusCzech RepublicDenmarkDjiboutiDominicaDominican RepublicEarly-demographic dividendEast Asia & PacificEast Asia & Pacific (excluding high income)East Asia & Pacific (IDA & IBRD countries)EcuadorEgypt, Arab Rep.El SalvadorEquatorial GuineaEritreaEstoniaEthiopiaEuro areaEurope & Central AsiaEurope & Central Asia (excluding high income)Europe & Central Asia (IDA & IBRD countries)European UnionFaroe IslandsFijiFinlandFragile and conflict affected situationsFranceFrench PolynesiaGabonGambia, TheGeorgiaGermanyGhanaGreeceGrenadaGuatemalaGuineaGuinea-BissauGuyanaHaitiHeavily indebted poor countries (HIPC)High incomeHondurasHong Kong SAR, ChinaHungaryIBRD onlyIcelandIDA & IBRD totalIDA blendIDA onlyIDA totalIndiaIndonesiaIran, Islamic Rep.IraqIrelandIsraelItalyJamaicaJapanJordanKazakhstanKenyaKiribatiKorea, Rep.KosovoKuwaitKyrgyz RepublicLao PDRLate-demographic dividendLatin America & Caribbean Latin America & Caribbean (excluding high income)Latin America & the Caribbean (IDA & IBRD countries)LatviaLeast developed countries: UN classificationLebanonLesothoLiberiaLibyaLithuaniaLow & middle incomeLow incomeLower middle incomeLuxembourgMacao SAR, ChinaMacedonia, FYRMadagascarMalawiMalaysiaMaldivesMaliMaltaMauritaniaMauritiusMexicoMicronesia, Fed. Sts.Middle East & North AfricaMiddle East & North Africa (excluding high income)Middle East & North Africa (IDA & IBRD countries)Middle incomeMoldovaMongoliaMontenegroMoroccoMozambiqueMyanmarNamibiaNepalNetherlandsNew CaledoniaNew ZealandNicaraguaNigerNigeriaNorth AmericaNorwayOECD membersOmanOther small statesPacific island small statesPakistanPalauPanamaPapua New GuineaParaguayPeruPhilippinesPolandPortugalPost-demographic dividendPre-demographic dividendPuerto RicoQatarRomaniaRussian FederationRwandaSamoaSaudi ArabiaSenegalSerbiaSeychellesSierra LeoneSingaporeSlovak RepublicSloveniaSmall statesSolomon IslandsSomaliaSouth AfricaSouth AsiaSouth Asia (IDA & IBRD)South SudanSpainSri LankaSt. Kitts and NevisSt. LuciaSt. Vincent and the GrenadinesSub-Saharan Africa Sub-Saharan Africa (excluding high income)Sub-Saharan Africa (IDA & IBRD countries)SudanSurinameSwazilandSwedenSwitzerlandSyrian Arab RepublicTajikistanTanzaniaThailandTimor-LesteTogoTongaTrinidad and TobagoTunisiaTurkeyTurkmenistanUgandaUkraineUnited Arab EmiratesUnited KingdomUnited StatesUpper middle incomeUruguayUzbekistanVanuatuVenezuela, RBVietnamWest Bank and GazaWorldYemen, Rep.ZambiaZimbabwe Timeline:
This timeline shows a graph from 1978 to 2016 of Grenada. No data until 1977. Number of actual observations by date: 39.
Source name:
World Development Indicators
Source organization:
World Bank national accounts data, and OECD National Accounts data files.
Categories, topics:
Economy & Growth, Trade
Last updated:
apr 23, 2017
Indicators value changes by year
Minimum:
67.896
jan 1, 2016
Maximum:
134.26
jan 1, 1982
At the date of observation
Value
Absolute change
Change from previous value
jan 1, 1978
111.759
+111.759
0.0%
jan 1, 1979
109.113
-2.647
-2.37%
jan 1, 1980
124.096
+14.983
13.73%
jan 1, 1981
126.727
+2.632
2.12%
jan 1, 1982
134.26
+7.533
5.94%
jan 1, 1983
123.172
-11.088
-8.26%
jan 1, 1984
109.452
-13.72
-11.14%
jan 1, 1985
102.567
-6.885
-6.29%
jan 1, 1986
111.766
+9.199
8.97%
jan 1, 1987
126.477
+14.711
13.16%
jan 1, 1988
116.817
-9.66
-7.64%
jan 1, 1989
112.014
-4.802
-4.11%
jan 1, 1990
100.647
-11.368
-10.15%
jan 1, 1991
105.214
+4.567
4.54%
jan 1, 1992
102.439
-2.774
-2.64%
jan 1, 1993
94.695
-7.744
-7.56%
jan 1, 1994
117.119
+22.424
23.68%
jan 1, 1995
110.246
-6.872
-5.87%
jan 1, 1996
100.074
-10.172
-9.23%
jan 1, 1997
110.232
+10.158
10.15%
jan 1, 1998
113.683
+3.452
3.13%
jan 1, 1999
120.474
+6.791
5.97%
jan 1, 2000
127.581
+7.107
5.9%
jan 1, 2001
104.965
-22.615
-17.73%
jan 1, 2002
91.718
-13.247
-12.62%
jan 1, 2003
82.306
-9.412
-10.26%
jan 1, 2004
83.077
+0.77
0.94%
jan 1, 2005
86.27
+3.193
3.84%
jan 1, 2006
78.38
-7.89
-9.15%
jan 1, 2007
80.843
+2.463
3.14%
jan 1, 2008
86.438
+5.595
6.92%
jan 1, 2009
81.421
-5.017
-5.8%
jan 1, 2010
72.35
-9.071
-11.14%
jan 1, 2011
75.794
+3.444
4.76%
jan 1, 2012
78.999
+3.205
4.23%
jan 1, 2013
78.361
-0.638
-0.81%
jan 1, 2014
78.84
+0.479
0.61%
jan 1, 2015
71.558
-7.282
-9.24%
jan 1, 2016
67.896
-3.662
-5.12%
Ranking of countries by current statistics by years


Comments: