29
/
en
AIzaSyAYiBZKx7MnpbEhh9jyipgxe19OcubqV5w
April 1, 2024
134687
France
FRA
true
2
1
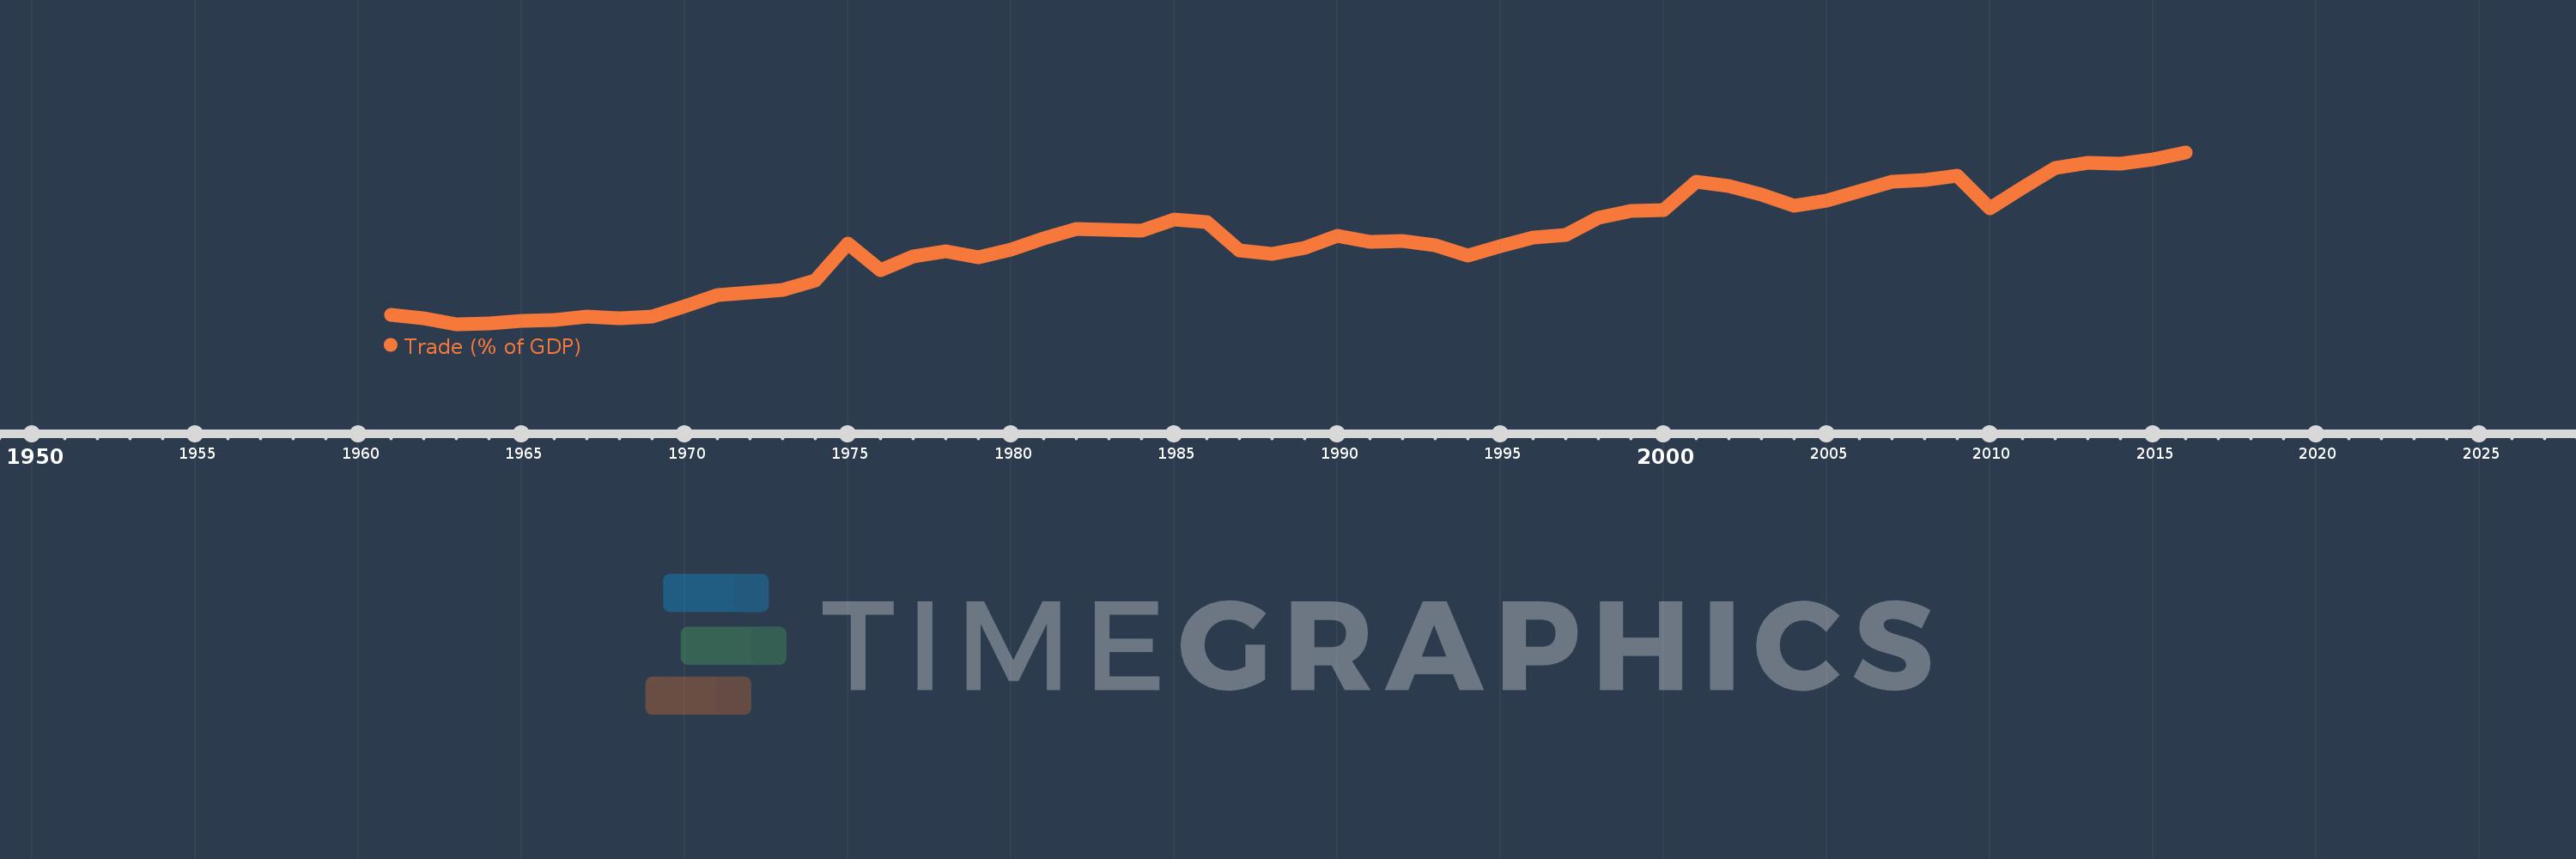
Trade (% of GDP)
2016,2015,2014,2013,2012,2011,2010,2009,2008,2007,2006,2005,2004,2003,2002,2001,2000,1999,1998,1997,1996,1995,1994,1993,1992,1991,1990,1989,1988,1987,1986,1985,1984,1983,1982,1981,1980,1979,1978,1977,1976,1975,1974,1973,1972,1971,1970,1969,1968,1967,1966,1965,1964,1963,1962,1961
This statistics in other country:
AfghanistanAlbaniaAlgeriaAngolaAntigua and BarbudaArab WorldArgentinaArmeniaArubaAustraliaAustriaAzerbaijanBahamas, TheBahrainBangladeshBarbadosBelarusBelgiumBelizeBeninBermudaBhutanBoliviaBosnia and HerzegovinaBotswanaBrazilBrunei DarussalamBulgariaBurkina FasoBurundiCabo VerdeCambodiaCameroonCanadaCaribbean small statesCentral African RepublicCentral Europe and the BalticsChadChileChinaColombiaComorosCongo, Dem. Rep.Congo, Rep.Costa RicaCote d'IvoireCroatiaCubaCyprusCzech RepublicDenmarkDjiboutiDominicaDominican RepublicEarly-demographic dividendEast Asia & PacificEast Asia & Pacific (excluding high income)East Asia & Pacific (IDA & IBRD countries)EcuadorEgypt, Arab Rep.El SalvadorEquatorial GuineaEritreaEstoniaEthiopiaEuro areaEurope & Central AsiaEurope & Central Asia (excluding high income)Europe & Central Asia (IDA & IBRD countries)European UnionFaroe IslandsFijiFinlandFragile and conflict affected situationsFranceFrench PolynesiaGabonGambia, TheGeorgiaGermanyGhanaGreeceGrenadaGuatemalaGuineaGuinea-BissauGuyanaHaitiHeavily indebted poor countries (HIPC)High incomeHondurasHong Kong SAR, ChinaHungaryIBRD onlyIcelandIDA & IBRD totalIDA blendIDA onlyIDA totalIndiaIndonesiaIran, Islamic Rep.IraqIrelandIsraelItalyJamaicaJapanJordanKazakhstanKenyaKiribatiKorea, Rep.KosovoKuwaitKyrgyz RepublicLao PDRLate-demographic dividendLatin America & Caribbean Latin America & Caribbean (excluding high income)Latin America & the Caribbean (IDA & IBRD countries)LatviaLeast developed countries: UN classificationLebanonLesothoLiberiaLibyaLithuaniaLow & middle incomeLow incomeLower middle incomeLuxembourgMacao SAR, ChinaMacedonia, FYRMadagascarMalawiMalaysiaMaldivesMaliMaltaMauritaniaMauritiusMexicoMicronesia, Fed. Sts.Middle East & North AfricaMiddle East & North Africa (excluding high income)Middle East & North Africa (IDA & IBRD countries)Middle incomeMoldovaMongoliaMontenegroMoroccoMozambiqueMyanmarNamibiaNepalNetherlandsNew CaledoniaNew ZealandNicaraguaNigerNigeriaNorth AmericaNorwayOECD membersOmanOther small statesPacific island small statesPakistanPalauPanamaPapua New GuineaParaguayPeruPhilippinesPolandPortugalPost-demographic dividendPre-demographic dividendPuerto RicoQatarRomaniaRussian FederationRwandaSamoaSaudi ArabiaSenegalSerbiaSeychellesSierra LeoneSingaporeSlovak RepublicSloveniaSmall statesSolomon IslandsSomaliaSouth AfricaSouth AsiaSouth Asia (IDA & IBRD)South SudanSpainSri LankaSt. Kitts and NevisSt. LuciaSt. Vincent and the GrenadinesSub-Saharan Africa Sub-Saharan Africa (excluding high income)Sub-Saharan Africa (IDA & IBRD countries)SudanSurinameSwazilandSwedenSwitzerlandSyrian Arab RepublicTajikistanTanzaniaThailandTimor-LesteTogoTongaTrinidad and TobagoTunisiaTurkeyTurkmenistanUgandaUkraineUnited Arab EmiratesUnited KingdomUnited StatesUpper middle incomeUruguayUzbekistanVanuatuVenezuela, RBVietnamWest Bank and GazaWorldYemen, Rep.ZambiaZimbabwe Timeline:
This timeline shows a graph from 1961 to 2016 of France. No data until 1960. Number of actual observations by date: 56.
Source name:
World Development Indicators
Source organization:
World Bank national accounts data, and OECD National Accounts data files.
Categories, topics:
Economy & Growth, Trade
Last updated:
apr 23, 2017
Indicators value changes by year
Maximum:
61.432
jan 1, 2016
At the date of observation
Value
Absolute change
Change from previous value
jan 1, 1961
26.965
+26.965
0.0%
jan 1, 1962
26.258
-0.707
-2.62%
jan 1, 1963
24.95
-1.308
-4.98%
jan 1, 1964
25.063
+0.113
0.45%
jan 1, 1965
25.686
+0.623
2.49%
jan 1, 1966
25.803
+0.117
0.46%
jan 1, 1967
26.537
+0.734
2.84%
jan 1, 1968
26.249
-0.288
-1.09%
jan 1, 1969
26.636
+0.387
1.47%
jan 1, 1970
28.814
+2.178
8.18%
jan 1, 1971
31.133
+2.319
8.05%
jan 1, 1972
31.733
+0.6
1.93%
jan 1, 1973
32.217
+0.484
1.53%
jan 1, 1974
34.163
+1.946
6.04%
jan 1, 1975
42.082
+7.919
23.18%
jan 1, 1976
36.453
-5.629
-13.38%
jan 1, 1977
39.363
+2.91
7.98%
jan 1, 1978
40.39
+1.028
2.61%
jan 1, 1979
39.19
-1.2
-2.97%
jan 1, 1980
40.78
+1.59
4.06%
jan 1, 1981
43.238
+2.458
6.03%
jan 1, 1982
45.111
+1.874
4.33%
jan 1, 1983
44.96
-0.151
-0.33%
jan 1, 1984
44.832
-0.128
-0.28%
jan 1, 1985
47.215
+2.382
5.31%
jan 1, 1986
46.68
-0.535
-1.13%
jan 1, 1987
40.576
-6.104
-13.08%
jan 1, 1988
39.974
-0.602
-1.48%
jan 1, 1989
41.076
+1.102
2.76%
jan 1, 1990
43.675
+2.6
6.33%
jan 1, 1991
42.425
-1.25
-2.86%
jan 1, 1992
42.667
+0.242
0.57%
jan 1, 1993
41.657
-1.01
-2.37%
jan 1, 1994
39.572
-2.086
-5.01%
jan 1, 1995
41.475
+1.904
4.81%
jan 1, 1996
43.272
+1.797
4.33%
jan 1, 1997
43.937
+0.665
1.54%
jan 1, 1998
47.581
+3.645
8.3%
jan 1, 1999
49.006
+1.424
2.99%
jan 1, 2000
49.233
+0.227
0.46%
jan 1, 2001
55.259
+6.026
12.24%
jan 1, 2002
54.317
-0.943
-1.71%
jan 1, 2003
52.416
-1.901
-3.5%
jan 1, 2004
50.132
-2.284
-4.36%
jan 1, 2005
51.197
+1.065
2.12%
jan 1, 2006
53.152
+1.955
3.82%
jan 1, 2007
55.187
+2.035
3.83%
jan 1, 2008
55.548
+0.36
0.65%
jan 1, 2009
56.524
+0.976
1.76%
jan 1, 2010
49.568
-6.956
-12.31%
jan 1, 2011
53.968
+4.401
8.88%
jan 1, 2012
58.169
+4.201
7.78%
jan 1, 2013
59.2
+1.031
1.77%
jan 1, 2014
59.099
-0.102
-0.17%
jan 1, 2015
59.881
+0.783
1.32%
jan 1, 2016
61.432
+1.551
2.59%
Ranking of countries by current statistics by years


Comments: