29
/
en
AIzaSyAYiBZKx7MnpbEhh9jyipgxe19OcubqV5w
April 1, 2024
69340
Antigua and Barbuda
ATG
true
2
1
Trade (% of GDP)
2016,2015,2014,2013,2012,2011,2010,2009,2008,2007,2006,2005,2004,2003,2002,2001,2000,1999,1998,1997,1996,1995,1994,1993,1992,1991,1990,1989,1988,1987,1986,1985,1984,1983,1982,1981,1980,1979,1978
This statistics in other country:
AfghanistanAlbaniaAlgeriaAngolaAntigua and BarbudaArab WorldArgentinaArmeniaArubaAustraliaAustriaAzerbaijanBahamas, TheBahrainBangladeshBarbadosBelarusBelgiumBelizeBeninBermudaBhutanBoliviaBosnia and HerzegovinaBotswanaBrazilBrunei DarussalamBulgariaBurkina FasoBurundiCabo VerdeCambodiaCameroonCanadaCaribbean small statesCentral African RepublicCentral Europe and the BalticsChadChileChinaColombiaComorosCongo, Dem. Rep.Congo, Rep.Costa RicaCote d'IvoireCroatiaCubaCyprusCzech RepublicDenmarkDjiboutiDominicaDominican RepublicEarly-demographic dividendEast Asia & PacificEast Asia & Pacific (excluding high income)East Asia & Pacific (IDA & IBRD countries)EcuadorEgypt, Arab Rep.El SalvadorEquatorial GuineaEritreaEstoniaEthiopiaEuro areaEurope & Central AsiaEurope & Central Asia (excluding high income)Europe & Central Asia (IDA & IBRD countries)European UnionFaroe IslandsFijiFinlandFragile and conflict affected situationsFranceFrench PolynesiaGabonGambia, TheGeorgiaGermanyGhanaGreeceGrenadaGuatemalaGuineaGuinea-BissauGuyanaHaitiHeavily indebted poor countries (HIPC)High incomeHondurasHong Kong SAR, ChinaHungaryIBRD onlyIcelandIDA & IBRD totalIDA blendIDA onlyIDA totalIndiaIndonesiaIran, Islamic Rep.IraqIrelandIsraelItalyJamaicaJapanJordanKazakhstanKenyaKiribatiKorea, Rep.KosovoKuwaitKyrgyz RepublicLao PDRLate-demographic dividendLatin America & Caribbean Latin America & Caribbean (excluding high income)Latin America & the Caribbean (IDA & IBRD countries)LatviaLeast developed countries: UN classificationLebanonLesothoLiberiaLibyaLithuaniaLow & middle incomeLow incomeLower middle incomeLuxembourgMacao SAR, ChinaMacedonia, FYRMadagascarMalawiMalaysiaMaldivesMaliMaltaMauritaniaMauritiusMexicoMicronesia, Fed. Sts.Middle East & North AfricaMiddle East & North Africa (excluding high income)Middle East & North Africa (IDA & IBRD countries)Middle incomeMoldovaMongoliaMontenegroMoroccoMozambiqueMyanmarNamibiaNepalNetherlandsNew CaledoniaNew ZealandNicaraguaNigerNigeriaNorth AmericaNorwayOECD membersOmanOther small statesPacific island small statesPakistanPalauPanamaPapua New GuineaParaguayPeruPhilippinesPolandPortugalPost-demographic dividendPre-demographic dividendPuerto RicoQatarRomaniaRussian FederationRwandaSamoaSaudi ArabiaSenegalSerbiaSeychellesSierra LeoneSingaporeSlovak RepublicSloveniaSmall statesSolomon IslandsSomaliaSouth AfricaSouth AsiaSouth Asia (IDA & IBRD)South SudanSpainSri LankaSt. Kitts and NevisSt. LuciaSt. Vincent and the GrenadinesSub-Saharan Africa Sub-Saharan Africa (excluding high income)Sub-Saharan Africa (IDA & IBRD countries)SudanSurinameSwazilandSwedenSwitzerlandSyrian Arab RepublicTajikistanTanzaniaThailandTimor-LesteTogoTongaTrinidad and TobagoTunisiaTurkeyTurkmenistanUgandaUkraineUnited Arab EmiratesUnited KingdomUnited StatesUpper middle incomeUruguayUzbekistanVanuatuVenezuela, RBVietnamWest Bank and GazaWorldYemen, Rep.ZambiaZimbabwe Timeline:
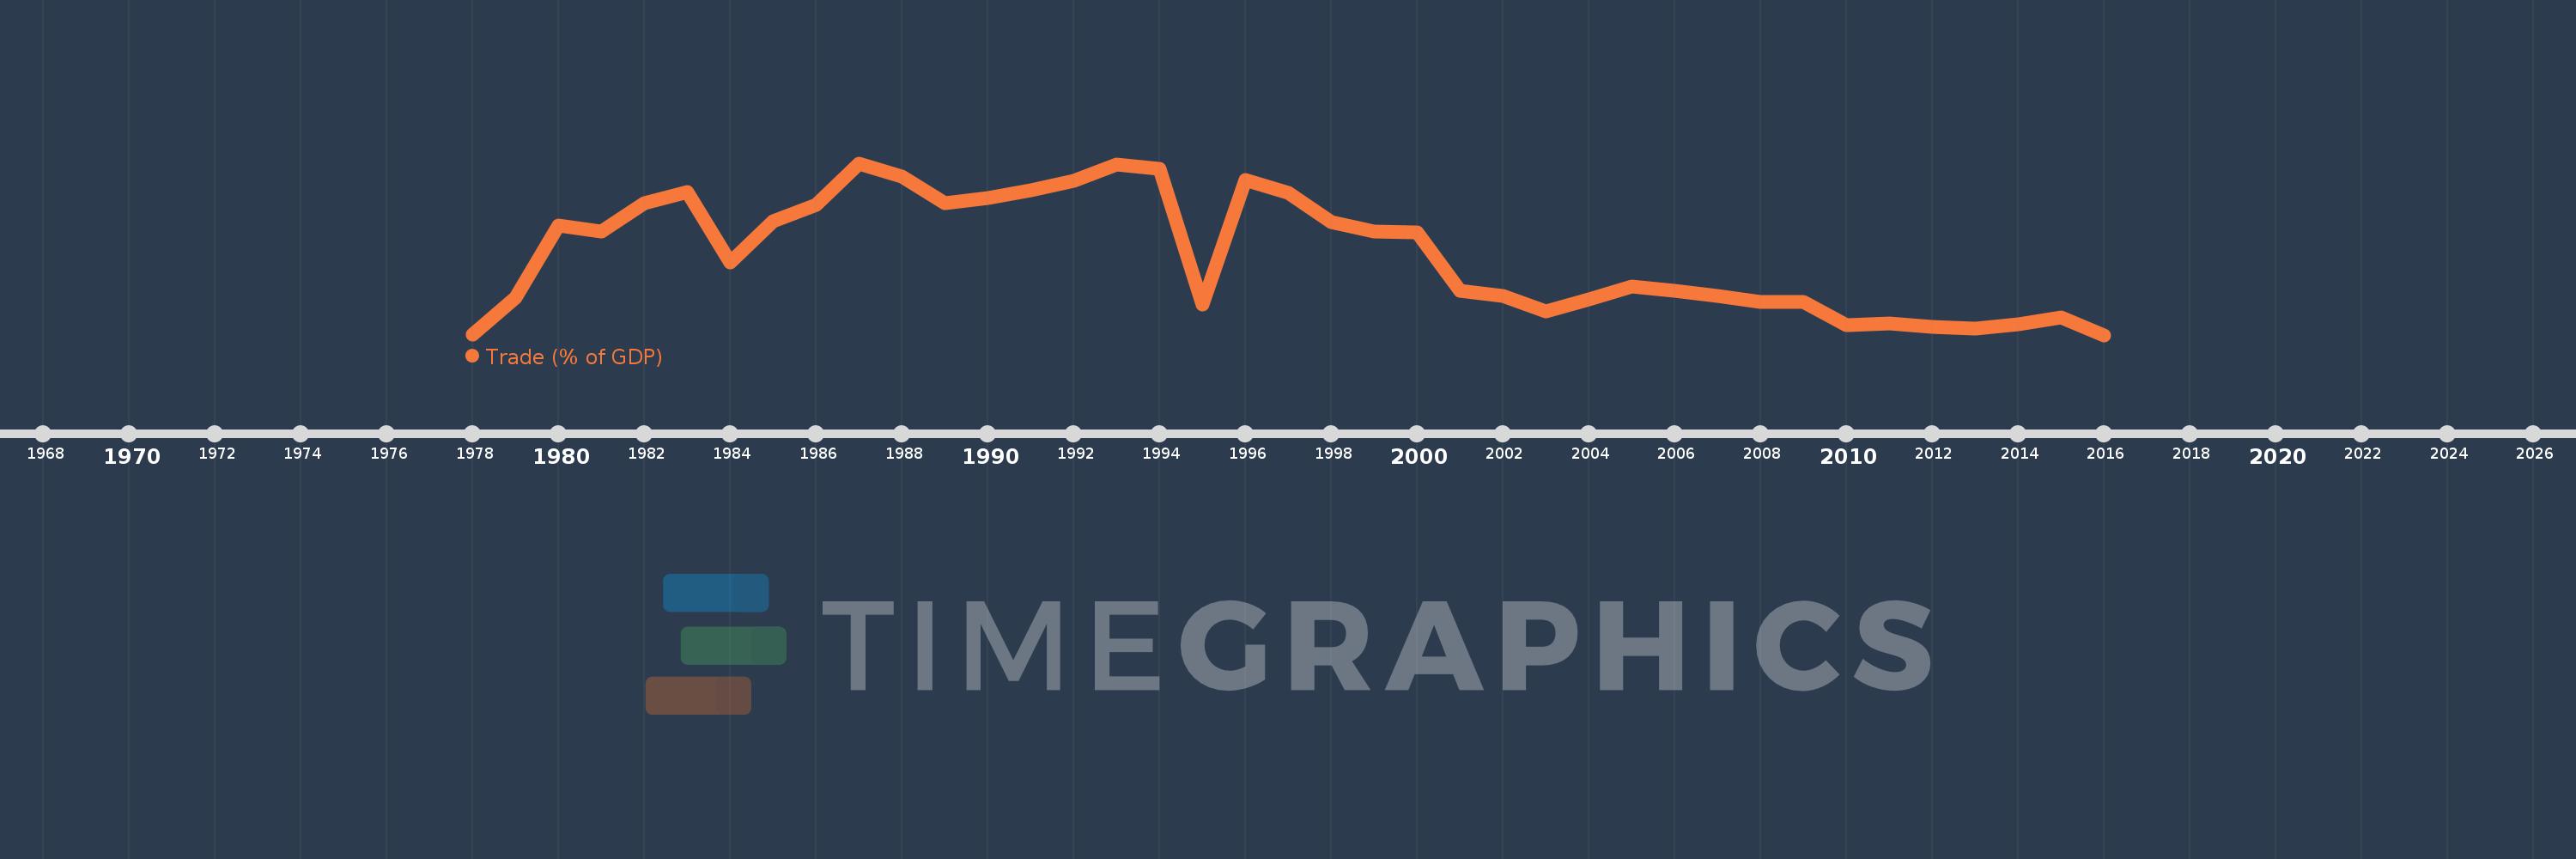
This timeline shows a graph from 1978 to 2016 of Antigua and Barbuda. No data until 1977. Number of actual observations by date: 39.
Source name:
World Development Indicators
Source organization:
World Bank national accounts data, and OECD National Accounts data files.
Categories, topics:
Economy & Growth, Trade
Last updated:
apr 23, 2017
Indicators value changes by year
Minimum:
99.971
jan 1, 2016
Maximum:
189.877
jan 1, 1987
At the date of observation
Value
Absolute change
Change from previous value
jan 1, 1978
100.33
+100.33
0.0%
jan 1, 1979
119.648
+19.317
19.25%
jan 1, 1980
157.242
+37.594
31.42%
jan 1, 1981
153.977
-3.264
-2.08%
jan 1, 1982
168.799
+14.822
9.63%
jan 1, 1983
174.959
+6.16
3.65%
jan 1, 1984
137.822
-37.137
-21.23%
jan 1, 1985
159.749
+21.926
15.91%
jan 1, 1986
167.877
+8.128
5.09%
jan 1, 1987
189.877
+22.0
13.1%
jan 1, 1988
183.013
-6.864
-3.61%
jan 1, 1989
169.023
-13.99
-7.64%
jan 1, 1990
171.766
+2.743
1.62%
jan 1, 1991
175.925
+4.159
2.42%
jan 1, 1992
180.751
+4.826
2.74%
jan 1, 1993
189.405
+8.654
4.79%
jan 1, 1994
186.936
-2.469
-1.3%
jan 1, 1995
116.076
-70.861
-37.91%
jan 1, 1996
180.896
+64.821
55.84%
jan 1, 1997
174.228
-6.668
-3.69%
jan 1, 1998
158.933
-15.295
-8.78%
jan 1, 1999
154.156
-4.778
-3.01%
jan 1, 2000
153.739
-0.416
-0.27%
jan 1, 2001
123.153
-30.586
-19.89%
jan 1, 2002
120.438
-2.716
-2.2%
jan 1, 2003
112.433
-8.005
-6.65%
jan 1, 2004
118.737
+6.305
5.61%
jan 1, 2005
125.375
+6.637
5.59%
jan 1, 2006
123.122
-2.252
-1.8%
jan 1, 2007
120.389
-2.734
-2.22%
jan 1, 2008
117.406
-2.983
-2.48%
jan 1, 2009
117.087
-0.319
-0.27%
jan 1, 2010
105.114
-11.974
-10.23%
jan 1, 2011
105.92
+0.807
0.77%
jan 1, 2012
104.355
-1.565
-1.48%
jan 1, 2013
103.37
-0.984
-0.94%
jan 1, 2014
105.477
+2.107
2.04%
jan 1, 2015
109.202
+3.725
3.53%
jan 1, 2016
99.971
-9.232
-8.45%
Ranking of countries by current statistics by years


Comments: