29
/
en
AIzaSyAYiBZKx7MnpbEhh9jyipgxe19OcubqV5w
April 1, 2024
226496
Portugal
PRT
true
2
1
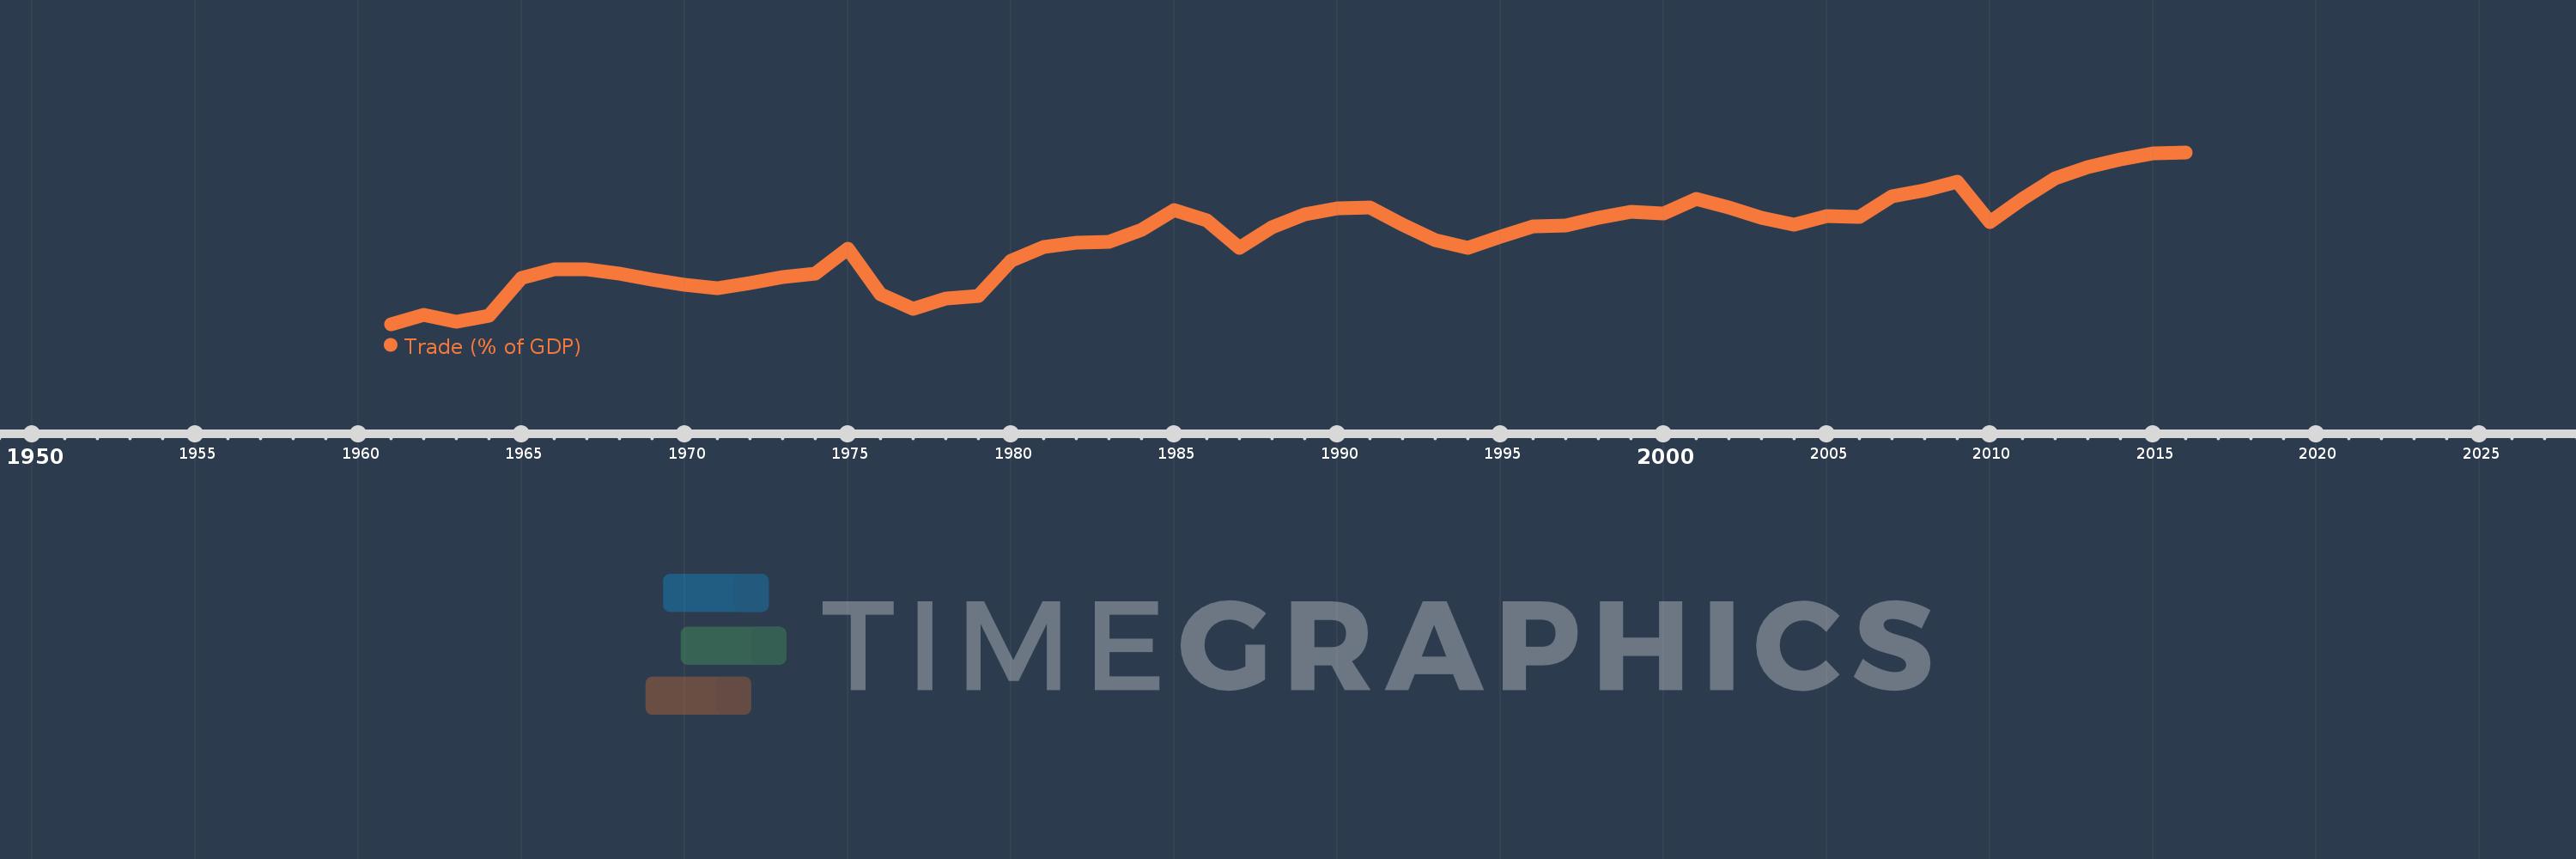
Trade (% of GDP)
2016,2015,2014,2013,2012,2011,2010,2009,2008,2007,2006,2005,2004,2003,2002,2001,2000,1999,1998,1997,1996,1995,1994,1993,1992,1991,1990,1989,1988,1987,1986,1985,1984,1983,1982,1981,1980,1979,1978,1977,1976,1975,1974,1973,1972,1971,1970,1969,1968,1967,1966,1965,1964,1963,1962,1961
This statistics in other country:
AfghanistanAlbaniaAlgeriaAngolaAntigua and BarbudaArab WorldArgentinaArmeniaArubaAustraliaAustriaAzerbaijanBahamas, TheBahrainBangladeshBarbadosBelarusBelgiumBelizeBeninBermudaBhutanBoliviaBosnia and HerzegovinaBotswanaBrazilBrunei DarussalamBulgariaBurkina FasoBurundiCabo VerdeCambodiaCameroonCanadaCaribbean small statesCentral African RepublicCentral Europe and the BalticsChadChileChinaColombiaComorosCongo, Dem. Rep.Congo, Rep.Costa RicaCote d'IvoireCroatiaCubaCyprusCzech RepublicDenmarkDjiboutiDominicaDominican RepublicEarly-demographic dividendEast Asia & PacificEast Asia & Pacific (excluding high income)East Asia & Pacific (IDA & IBRD countries)EcuadorEgypt, Arab Rep.El SalvadorEquatorial GuineaEritreaEstoniaEthiopiaEuro areaEurope & Central AsiaEurope & Central Asia (excluding high income)Europe & Central Asia (IDA & IBRD countries)European UnionFaroe IslandsFijiFinlandFragile and conflict affected situationsFranceFrench PolynesiaGabonGambia, TheGeorgiaGermanyGhanaGreeceGrenadaGuatemalaGuineaGuinea-BissauGuyanaHaitiHeavily indebted poor countries (HIPC)High incomeHondurasHong Kong SAR, ChinaHungaryIBRD onlyIcelandIDA & IBRD totalIDA blendIDA onlyIDA totalIndiaIndonesiaIran, Islamic Rep.IraqIrelandIsraelItalyJamaicaJapanJordanKazakhstanKenyaKiribatiKorea, Rep.KosovoKuwaitKyrgyz RepublicLao PDRLate-demographic dividendLatin America & Caribbean Latin America & Caribbean (excluding high income)Latin America & the Caribbean (IDA & IBRD countries)LatviaLeast developed countries: UN classificationLebanonLesothoLiberiaLibyaLithuaniaLow & middle incomeLow incomeLower middle incomeLuxembourgMacao SAR, ChinaMacedonia, FYRMadagascarMalawiMalaysiaMaldivesMaliMaltaMauritaniaMauritiusMexicoMicronesia, Fed. Sts.Middle East & North AfricaMiddle East & North Africa (excluding high income)Middle East & North Africa (IDA & IBRD countries)Middle incomeMoldovaMongoliaMontenegroMoroccoMozambiqueMyanmarNamibiaNepalNetherlandsNew CaledoniaNew ZealandNicaraguaNigerNigeriaNorth AmericaNorwayOECD membersOmanOther small statesPacific island small statesPakistanPalauPanamaPapua New GuineaParaguayPeruPhilippinesPolandPortugalPost-demographic dividendPre-demographic dividendPuerto RicoQatarRomaniaRussian FederationRwandaSamoaSaudi ArabiaSenegalSerbiaSeychellesSierra LeoneSingaporeSlovak RepublicSloveniaSmall statesSolomon IslandsSomaliaSouth AfricaSouth AsiaSouth Asia (IDA & IBRD)South SudanSpainSri LankaSt. Kitts and NevisSt. LuciaSt. Vincent and the GrenadinesSub-Saharan Africa Sub-Saharan Africa (excluding high income)Sub-Saharan Africa (IDA & IBRD countries)SudanSurinameSwazilandSwedenSwitzerlandSyrian Arab RepublicTajikistanTanzaniaThailandTimor-LesteTogoTongaTrinidad and TobagoTunisiaTurkeyTurkmenistanUgandaUkraineUnited Arab EmiratesUnited KingdomUnited StatesUpper middle incomeUruguayUzbekistanVanuatuVenezuela, RBVietnamWest Bank and GazaWorldYemen, Rep.ZambiaZimbabwe Timeline:
This timeline shows a graph from 1961 to 2016 of Portugal. No data until 1960. Number of actual observations by date: 56.
Source name:
World Development Indicators
Source organization:
World Bank national accounts data, and OECD National Accounts data files.
Categories, topics:
Economy & Growth, Trade
Last updated:
apr 23, 2017
Indicators value changes by year
Minimum:
33.478
jan 1, 1961
At the date of observation
Value
Absolute change
Change from previous value
jan 1, 1961
33.478
+33.478
0.0%
jan 1, 1962
36.052
+2.575
7.69%
jan 1, 1963
34.225
-1.827
-5.07%
jan 1, 1964
35.881
+1.655
4.84%
jan 1, 1965
46.026
+10.146
28.28%
jan 1, 1966
48.334
+2.308
5.01%
jan 1, 1967
48.245
-0.089
-0.18%
jan 1, 1968
47.097
-1.149
-2.38%
jan 1, 1969
45.495
-1.602
-3.4%
jan 1, 1970
44.016
-1.479
-3.25%
jan 1, 1971
43.208
-0.808
-1.83%
jan 1, 1972
44.669
+1.46
3.38%
jan 1, 1973
46.227
+1.558
3.49%
jan 1, 1974
47.231
+1.005
2.17%
jan 1, 1975
53.935
+6.704
14.19%
jan 1, 1976
41.528
-12.407
-23.0%
jan 1, 1977
37.71
-3.818
-9.19%
jan 1, 1978
40.523
+2.813
7.46%
jan 1, 1979
41.125
+0.602
1.49%
jan 1, 1980
50.727
+9.602
23.35%
jan 1, 1981
54.229
+3.502
6.9%
jan 1, 1982
55.57
+1.341
2.47%
jan 1, 1983
55.756
+0.186
0.33%
jan 1, 1984
58.92
+3.165
5.68%
jan 1, 1985
64.404
+5.484
9.31%
jan 1, 1986
61.509
-2.895
-4.5%
jan 1, 1987
54.013
-7.495
-12.19%
jan 1, 1988
59.568
+5.555
10.28%
jan 1, 1989
63.192
+3.623
6.08%
jan 1, 1990
64.861
+1.669
2.64%
jan 1, 1991
65.048
+0.187
0.29%
jan 1, 1992
60.359
-4.688
-7.21%
jan 1, 1993
56.3
-4.059
-6.72%
jan 1, 1994
54.169
-2.132
-3.79%
jan 1, 1995
57.17
+3.002
5.54%
jan 1, 1996
59.907
+2.737
4.79%
jan 1, 1997
60.208
+0.301
0.5%
jan 1, 1998
62.287
+2.079
3.45%
jan 1, 1999
63.811
+1.523
2.45%
jan 1, 2000
63.293
-0.518
-0.81%
jan 1, 2001
67.423
+4.13
6.53%
jan 1, 2002
65.064
-2.359
-3.5%
jan 1, 2003
62.161
-2.903
-4.46%
jan 1, 2004
60.438
-1.723
-2.77%
jan 1, 2005
62.763
+2.325
3.85%
jan 1, 2006
62.572
-0.191
-0.3%
jan 1, 2007
68.073
+5.501
8.79%
jan 1, 2008
69.653
+1.58
2.32%
jan 1, 2009
71.963
+2.31
3.32%
jan 1, 2010
61.082
-10.881
-15.12%
jan 1, 2011
67.305
+6.223
10.19%
jan 1, 2012
72.864
+5.559
8.26%
jan 1, 2013
75.929
+3.065
4.21%
jan 1, 2014
78.027
+2.098
2.76%
jan 1, 2015
79.711
+1.684
2.16%
jan 1, 2016
79.9
+0.189
0.24%
Ranking of countries by current statistics by years


Comments: