29
/
en
AIzaSyAYiBZKx7MnpbEhh9jyipgxe19OcubqV5w
April 1, 2024
65538
Albania
ALB
true
2
1
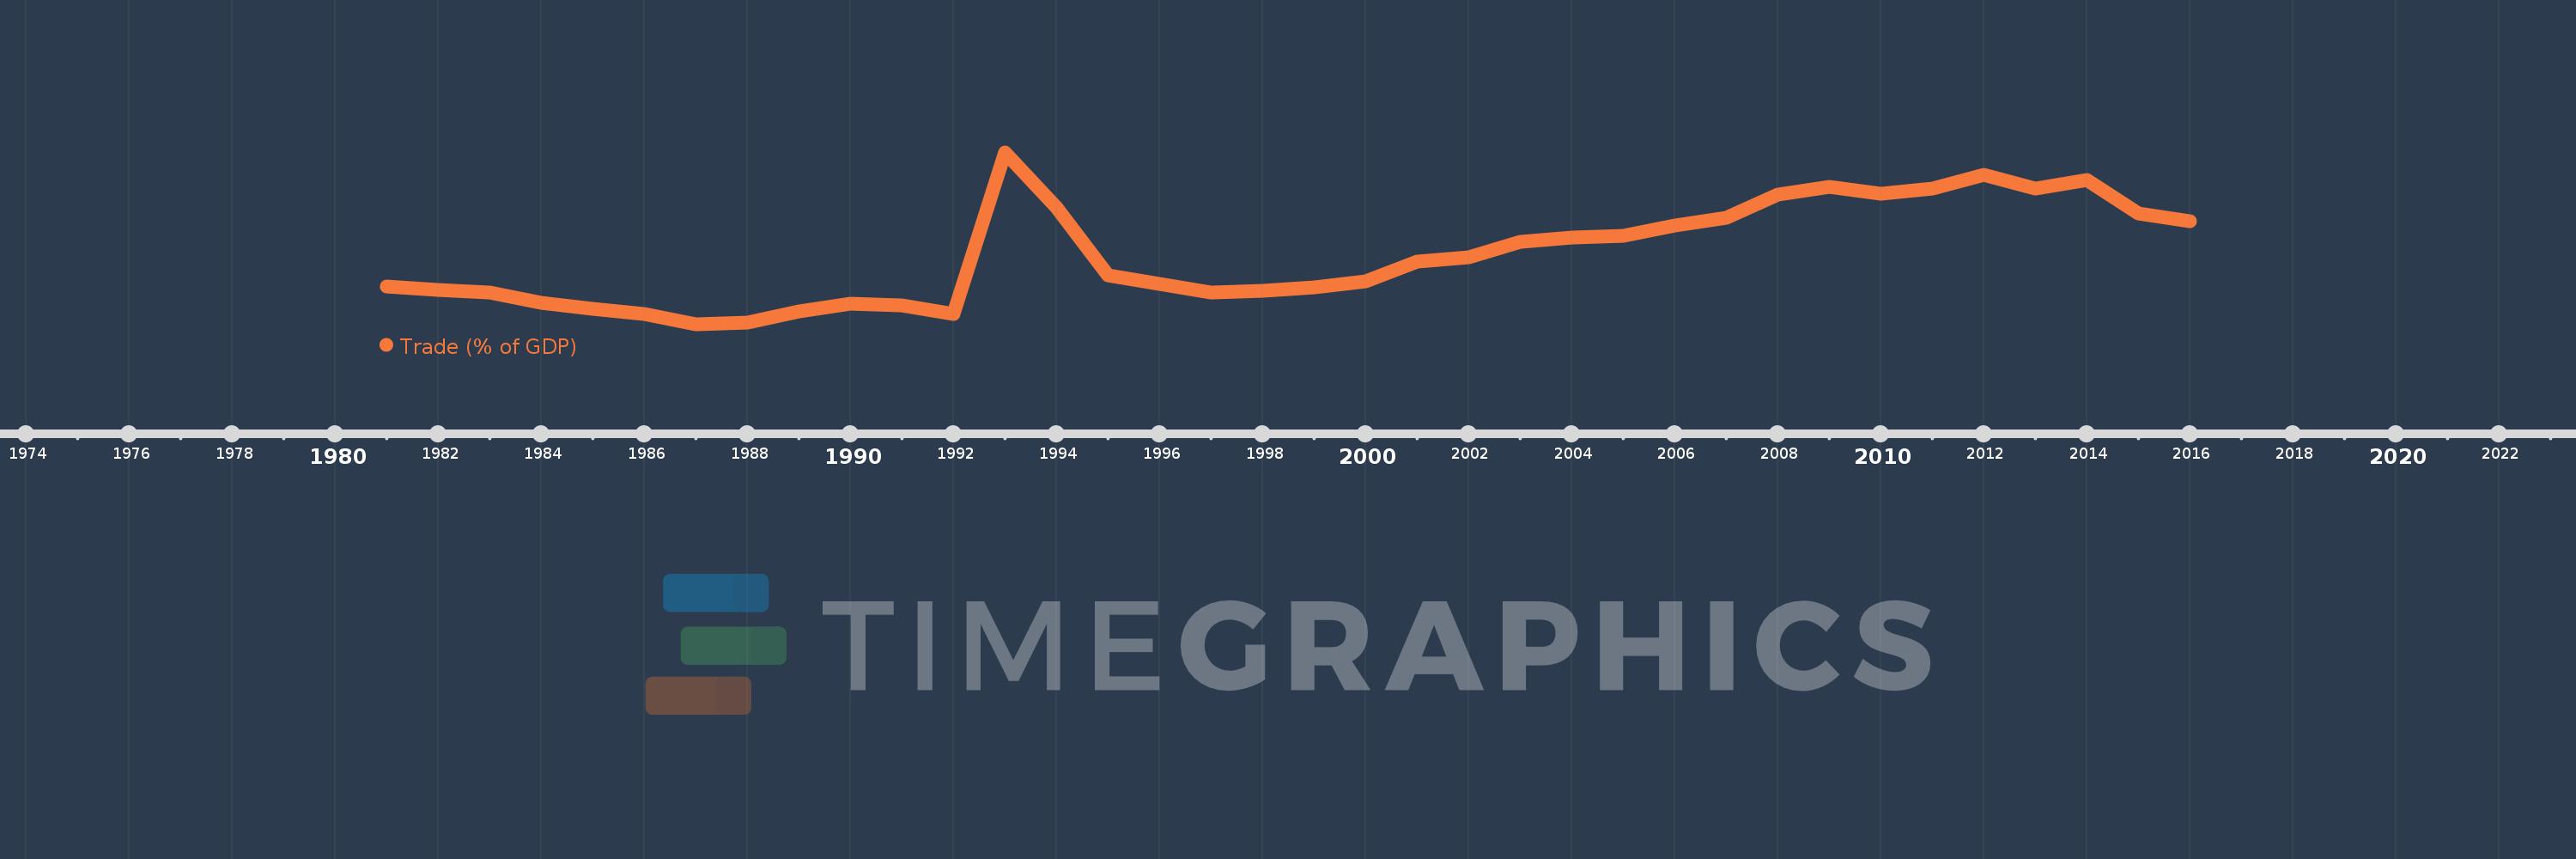
Trade (% of GDP)
2016,2015,2014,2013,2012,2011,2010,2009,2008,2007,2006,2005,2004,2003,2002,2001,2000,1999,1998,1997,1996,1995,1994,1993,1992,1991,1990,1989,1988,1987,1986,1985,1984,1983,1982,1981
This statistics in other country:
AfghanistanAlbaniaAlgeriaAngolaAntigua and BarbudaArab WorldArgentinaArmeniaArubaAustraliaAustriaAzerbaijanBahamas, TheBahrainBangladeshBarbadosBelarusBelgiumBelizeBeninBermudaBhutanBoliviaBosnia and HerzegovinaBotswanaBrazilBrunei DarussalamBulgariaBurkina FasoBurundiCabo VerdeCambodiaCameroonCanadaCaribbean small statesCentral African RepublicCentral Europe and the BalticsChadChileChinaColombiaComorosCongo, Dem. Rep.Congo, Rep.Costa RicaCote d'IvoireCroatiaCubaCyprusCzech RepublicDenmarkDjiboutiDominicaDominican RepublicEarly-demographic dividendEast Asia & PacificEast Asia & Pacific (excluding high income)East Asia & Pacific (IDA & IBRD countries)EcuadorEgypt, Arab Rep.El SalvadorEquatorial GuineaEritreaEstoniaEthiopiaEuro areaEurope & Central AsiaEurope & Central Asia (excluding high income)Europe & Central Asia (IDA & IBRD countries)European UnionFaroe IslandsFijiFinlandFragile and conflict affected situationsFranceFrench PolynesiaGabonGambia, TheGeorgiaGermanyGhanaGreeceGrenadaGuatemalaGuineaGuinea-BissauGuyanaHaitiHeavily indebted poor countries (HIPC)High incomeHondurasHong Kong SAR, ChinaHungaryIBRD onlyIcelandIDA & IBRD totalIDA blendIDA onlyIDA totalIndiaIndonesiaIran, Islamic Rep.IraqIrelandIsraelItalyJamaicaJapanJordanKazakhstanKenyaKiribatiKorea, Rep.KosovoKuwaitKyrgyz RepublicLao PDRLate-demographic dividendLatin America & Caribbean Latin America & Caribbean (excluding high income)Latin America & the Caribbean (IDA & IBRD countries)LatviaLeast developed countries: UN classificationLebanonLesothoLiberiaLibyaLithuaniaLow & middle incomeLow incomeLower middle incomeLuxembourgMacao SAR, ChinaMacedonia, FYRMadagascarMalawiMalaysiaMaldivesMaliMaltaMauritaniaMauritiusMexicoMicronesia, Fed. Sts.Middle East & North AfricaMiddle East & North Africa (excluding high income)Middle East & North Africa (IDA & IBRD countries)Middle incomeMoldovaMongoliaMontenegroMoroccoMozambiqueMyanmarNamibiaNepalNetherlandsNew CaledoniaNew ZealandNicaraguaNigerNigeriaNorth AmericaNorwayOECD membersOmanOther small statesPacific island small statesPakistanPalauPanamaPapua New GuineaParaguayPeruPhilippinesPolandPortugalPost-demographic dividendPre-demographic dividendPuerto RicoQatarRomaniaRussian FederationRwandaSamoaSaudi ArabiaSenegalSerbiaSeychellesSierra LeoneSingaporeSlovak RepublicSloveniaSmall statesSolomon IslandsSomaliaSouth AfricaSouth AsiaSouth Asia (IDA & IBRD)South SudanSpainSri LankaSt. Kitts and NevisSt. LuciaSt. Vincent and the GrenadinesSub-Saharan Africa Sub-Saharan Africa (excluding high income)Sub-Saharan Africa (IDA & IBRD countries)SudanSurinameSwazilandSwedenSwitzerlandSyrian Arab RepublicTajikistanTanzaniaThailandTimor-LesteTogoTongaTrinidad and TobagoTunisiaTurkeyTurkmenistanUgandaUkraineUnited Arab EmiratesUnited KingdomUnited StatesUpper middle incomeUruguayUzbekistanVanuatuVenezuela, RBVietnamWest Bank and GazaWorldYemen, Rep.ZambiaZimbabwe Timeline:
This timeline shows a graph from 1981 to 2016 of Albania. No data until 1980. Number of actual observations by date: 36.
Source name:
World Development Indicators
Source organization:
World Bank national accounts data, and OECD National Accounts data files.
Categories, topics:
Economy & Growth, Trade
Last updated:
apr 23, 2017
Indicators value changes by year
Minimum:
30.525
jan 1, 1987
Maximum:
100.003
jan 1, 1993
At the date of observation
Value
Absolute change
Change from previous value
jan 1, 1981
45.825
+45.825
0.0%
jan 1, 1982
44.498
-1.327
-2.9%
jan 1, 1983
43.253
-1.245
-2.8%
jan 1, 1984
39.006
-4.247
-9.82%
jan 1, 1985
36.79
-2.215
-5.68%
jan 1, 1986
34.685
-2.105
-5.72%
jan 1, 1987
30.525
-4.16
-11.99%
jan 1, 1988
31.029
+0.504
1.65%
jan 1, 1989
35.6
+4.571
14.73%
jan 1, 1990
38.659
+3.058
8.59%
jan 1, 1991
38.066
-0.593
-1.53%
jan 1, 1992
34.816
-3.249
-8.54%
jan 1, 1993
100.003
+65.186
187.23%
jan 1, 1994
77.715
-22.288
-22.29%
jan 1, 1995
50.302
-27.413
-35.27%
jan 1, 1996
46.987
-3.315
-6.59%
jan 1, 1997
43.22
-3.767
-8.02%
jan 1, 1998
43.936
+0.715
1.66%
jan 1, 1999
45.481
+1.546
3.52%
jan 1, 2000
48.03
+2.548
5.6%
jan 1, 2001
55.92
+7.891
16.43%
jan 1, 2002
57.43
+1.51
2.7%
jan 1, 2003
63.934
+6.504
11.32%
jan 1, 2004
65.441
+1.506
2.36%
jan 1, 2005
66.358
+0.917
1.4%
jan 1, 2006
70.295
+3.937
5.93%
jan 1, 2007
73.455
+3.16
4.49%
jan 1, 2008
82.872
+9.417
12.82%
jan 1, 2009
86.027
+3.155
3.81%
jan 1, 2010
83.36
-2.668
-3.1%
jan 1, 2011
85.465
+2.105
2.53%
jan 1, 2012
90.763
+5.298
6.2%
jan 1, 2013
85.339
-5.424
-5.98%
jan 1, 2014
88.93
+3.591
4.21%
jan 1, 2015
75.456
-13.474
-15.15%
jan 1, 2016
72.093
-3.363
-4.46%
Ranking of countries by current statistics by years


Comments: