29
/
en
AIzaSyAYiBZKx7MnpbEhh9jyipgxe19OcubqV5w
April 1, 2024
270168
Turkey
TUR
true
2
1
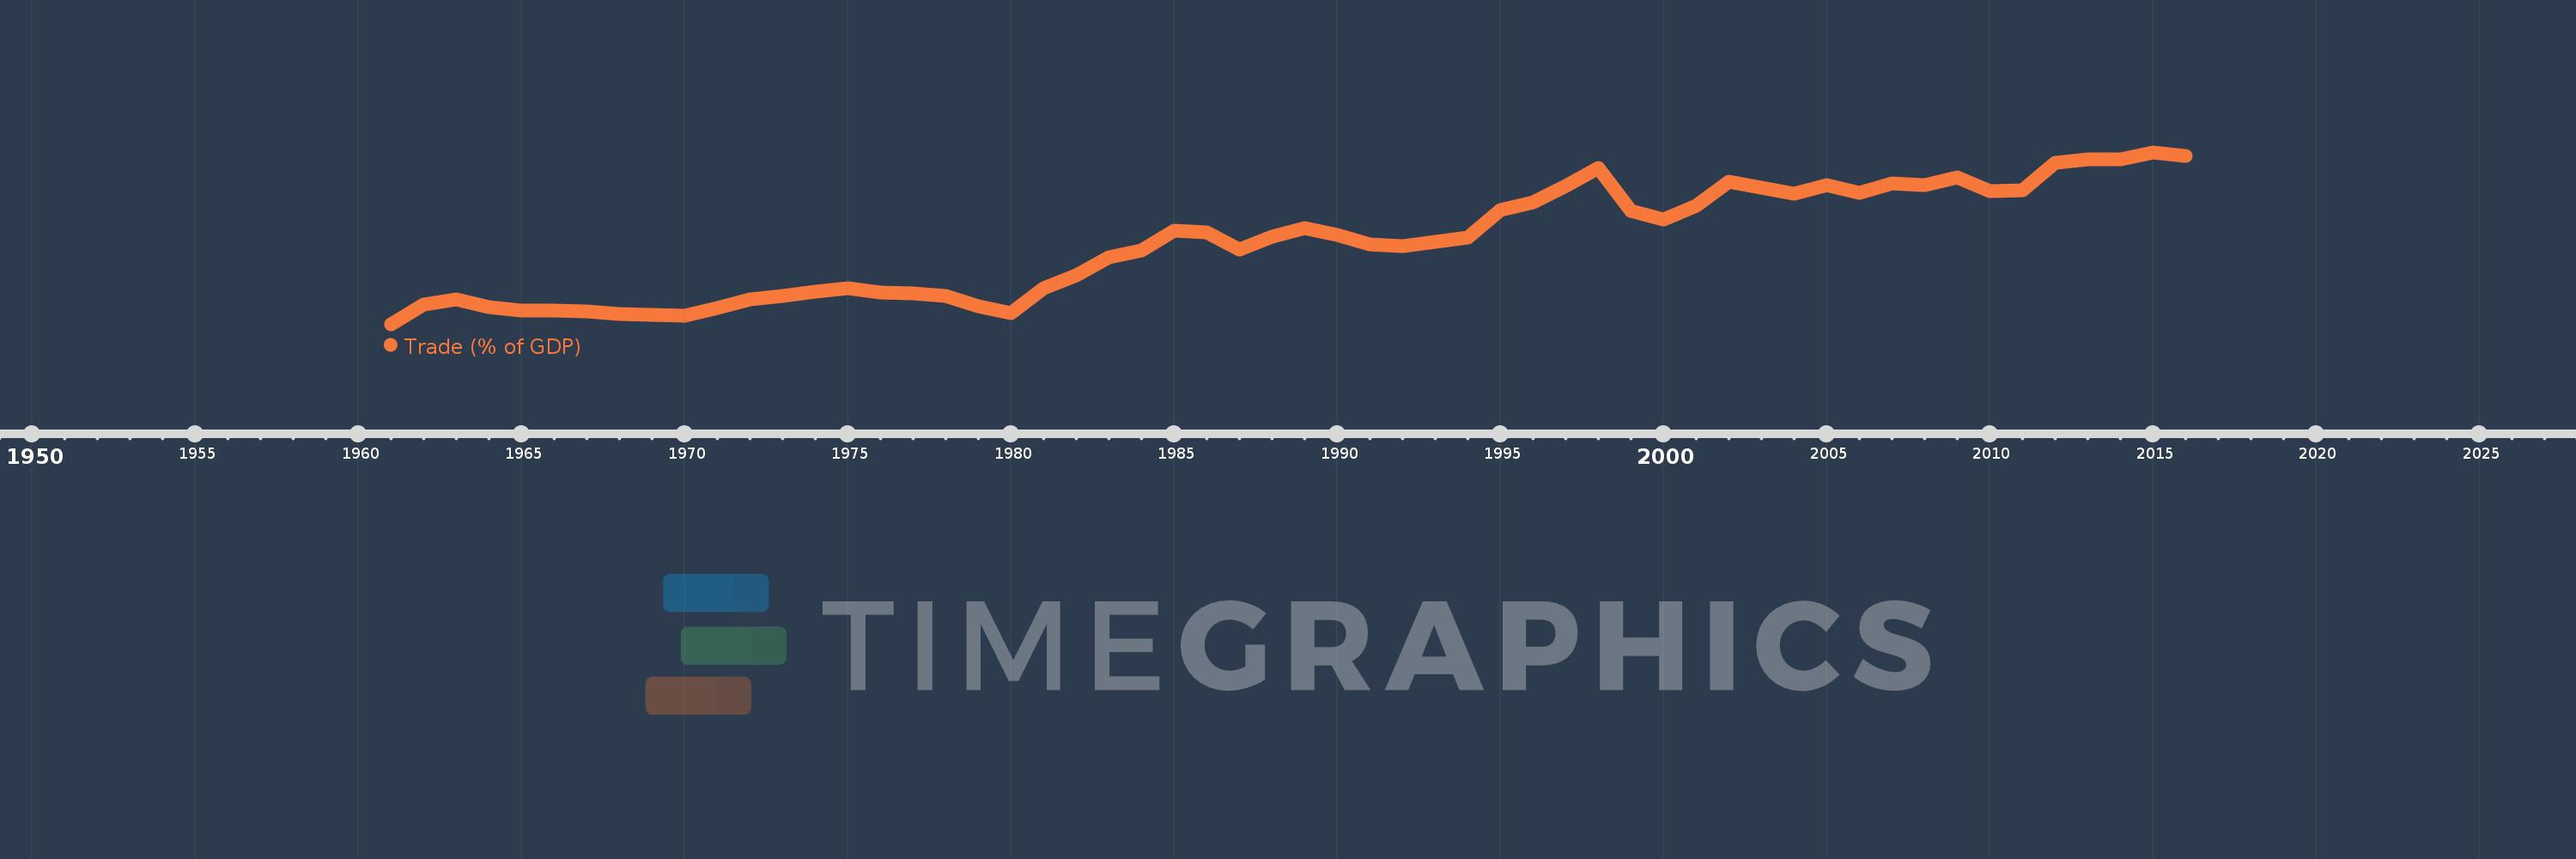
Trade (% of GDP)
2016,2015,2014,2013,2012,2011,2010,2009,2008,2007,2006,2005,2004,2003,2002,2001,2000,1999,1998,1997,1996,1995,1994,1993,1992,1991,1990,1989,1988,1987,1986,1985,1984,1983,1982,1981,1980,1979,1978,1977,1976,1975,1974,1973,1972,1971,1970,1969,1968,1967,1966,1965,1964,1963,1962,1961
This statistics in other country:
AfghanistanAlbaniaAlgeriaAngolaAntigua and BarbudaArab WorldArgentinaArmeniaArubaAustraliaAustriaAzerbaijanBahamas, TheBahrainBangladeshBarbadosBelarusBelgiumBelizeBeninBermudaBhutanBoliviaBosnia and HerzegovinaBotswanaBrazilBrunei DarussalamBulgariaBurkina FasoBurundiCabo VerdeCambodiaCameroonCanadaCaribbean small statesCentral African RepublicCentral Europe and the BalticsChadChileChinaColombiaComorosCongo, Dem. Rep.Congo, Rep.Costa RicaCote d'IvoireCroatiaCubaCyprusCzech RepublicDenmarkDjiboutiDominicaDominican RepublicEarly-demographic dividendEast Asia & PacificEast Asia & Pacific (excluding high income)East Asia & Pacific (IDA & IBRD countries)EcuadorEgypt, Arab Rep.El SalvadorEquatorial GuineaEritreaEstoniaEthiopiaEuro areaEurope & Central AsiaEurope & Central Asia (excluding high income)Europe & Central Asia (IDA & IBRD countries)European UnionFaroe IslandsFijiFinlandFragile and conflict affected situationsFranceFrench PolynesiaGabonGambia, TheGeorgiaGermanyGhanaGreeceGrenadaGuatemalaGuineaGuinea-BissauGuyanaHaitiHeavily indebted poor countries (HIPC)High incomeHondurasHong Kong SAR, ChinaHungaryIBRD onlyIcelandIDA & IBRD totalIDA blendIDA onlyIDA totalIndiaIndonesiaIran, Islamic Rep.IraqIrelandIsraelItalyJamaicaJapanJordanKazakhstanKenyaKiribatiKorea, Rep.KosovoKuwaitKyrgyz RepublicLao PDRLate-demographic dividendLatin America & Caribbean Latin America & Caribbean (excluding high income)Latin America & the Caribbean (IDA & IBRD countries)LatviaLeast developed countries: UN classificationLebanonLesothoLiberiaLibyaLithuaniaLow & middle incomeLow incomeLower middle incomeLuxembourgMacao SAR, ChinaMacedonia, FYRMadagascarMalawiMalaysiaMaldivesMaliMaltaMauritaniaMauritiusMexicoMicronesia, Fed. Sts.Middle East & North AfricaMiddle East & North Africa (excluding high income)Middle East & North Africa (IDA & IBRD countries)Middle incomeMoldovaMongoliaMontenegroMoroccoMozambiqueMyanmarNamibiaNepalNetherlandsNew CaledoniaNew ZealandNicaraguaNigerNigeriaNorth AmericaNorwayOECD membersOmanOther small statesPacific island small statesPakistanPalauPanamaPapua New GuineaParaguayPeruPhilippinesPolandPortugalPost-demographic dividendPre-demographic dividendPuerto RicoQatarRomaniaRussian FederationRwandaSamoaSaudi ArabiaSenegalSerbiaSeychellesSierra LeoneSingaporeSlovak RepublicSloveniaSmall statesSolomon IslandsSomaliaSouth AfricaSouth AsiaSouth Asia (IDA & IBRD)South SudanSpainSri LankaSt. Kitts and NevisSt. LuciaSt. Vincent and the GrenadinesSub-Saharan Africa Sub-Saharan Africa (excluding high income)Sub-Saharan Africa (IDA & IBRD countries)SudanSurinameSwazilandSwedenSwitzerlandSyrian Arab RepublicTajikistanTanzaniaThailandTimor-LesteTogoTongaTrinidad and TobagoTunisiaTurkeyTurkmenistanUgandaUkraineUnited Arab EmiratesUnited KingdomUnited StatesUpper middle incomeUruguayUzbekistanVanuatuVenezuela, RBVietnamWest Bank and GazaWorldYemen, Rep.ZambiaZimbabwe Timeline:
This timeline shows a graph from 1961 to 2016 of Turkey. No data until 1960. Number of actual observations by date: 56.
Source name:
World Development Indicators
Source organization:
World Bank national accounts data, and OECD National Accounts data files.
Categories, topics:
Economy & Growth, Trade
Last updated:
apr 23, 2017
Indicators value changes by year
Maximum:
60.013
jan 1, 2015
At the date of observation
Value
Absolute change
Change from previous value
jan 1, 1961
5.727
+5.727
0.0%
jan 1, 1962
11.911
+6.184
107.99%
jan 1, 1963
13.574
+1.663
13.96%
jan 1, 1964
11.159
-2.415
-17.79%
jan 1, 1965
9.94
-1.218
-10.92%
jan 1, 1966
9.953
+0.013
0.13%
jan 1, 1967
9.756
-0.197
-1.98%
jan 1, 1968
9.078
-0.678
-6.95%
jan 1, 1969
8.762
-0.316
-3.48%
jan 1, 1970
8.333
-0.429
-4.89%
jan 1, 1971
10.789
+2.455
29.47%
jan 1, 1972
13.567
+2.778
25.75%
jan 1, 1973
14.562
+0.995
7.34%
jan 1, 1974
16.126
+1.564
10.74%
jan 1, 1975
17.003
+0.876
5.43%
jan 1, 1976
15.653
-1.35
-7.94%
jan 1, 1977
15.525
-0.128
-0.82%
jan 1, 1978
14.522
-1.002
-6.46%
jan 1, 1979
11.436
-3.087
-21.26%
jan 1, 1980
9.1
-2.336
-20.43%
jan 1, 1981
17.09
+7.99
87.81%
jan 1, 1982
21.142
+4.052
23.71%
jan 1, 1983
26.881
+5.739
27.15%
jan 1, 1984
29.031
+2.15
8.0%
jan 1, 1985
35.28
+6.249
21.53%
jan 1, 1986
34.827
-0.453
-1.28%
jan 1, 1987
29.414
-5.413
-15.54%
jan 1, 1988
33.338
+3.924
13.34%
jan 1, 1989
36.207
+2.869
8.6%
jan 1, 1990
33.984
-2.223
-6.14%
jan 1, 1991
30.943
-3.041
-8.95%
jan 1, 1992
30.476
-0.467
-1.51%
jan 1, 1993
31.737
+1.261
4.14%
jan 1, 1994
33.017
+1.28
4.03%
jan 1, 1995
41.746
+8.729
26.44%
jan 1, 1996
44.243
+2.497
5.98%
jan 1, 1997
49.369
+5.127
11.59%
jan 1, 1998
54.97
+5.601
11.35%
jan 1, 1999
41.518
-13.452
-24.47%
jan 1, 2000
38.726
-2.792
-6.73%
jan 1, 2001
43.192
+4.466
11.53%
jan 1, 2002
50.756
+7.564
17.51%
jan 1, 2003
48.8
-1.956
-3.85%
jan 1, 2004
47.033
-1.767
-3.62%
jan 1, 2005
49.737
+2.704
5.75%
jan 1, 2006
47.207
-2.53
-5.09%
jan 1, 2007
50.251
+3.044
6.45%
jan 1, 2008
49.807
-0.444
-0.88%
jan 1, 2009
52.249
+2.441
4.9%
jan 1, 2010
47.738
-4.51
-8.63%
jan 1, 2011
47.969
+0.231
0.48%
jan 1, 2012
56.624
+8.655
18.04%
jan 1, 2013
57.755
+1.131
2.0%
jan 1, 2014
57.815
+0.06
0.1%
jan 1, 2015
60.013
+2.198
3.8%
jan 1, 2016
58.802
-1.211
-2.02%
Ranking of countries by current statistics by years


Comments: