29
/
en
AIzaSyAYiBZKx7MnpbEhh9jyipgxe19OcubqV5w
April 1, 2024
55226
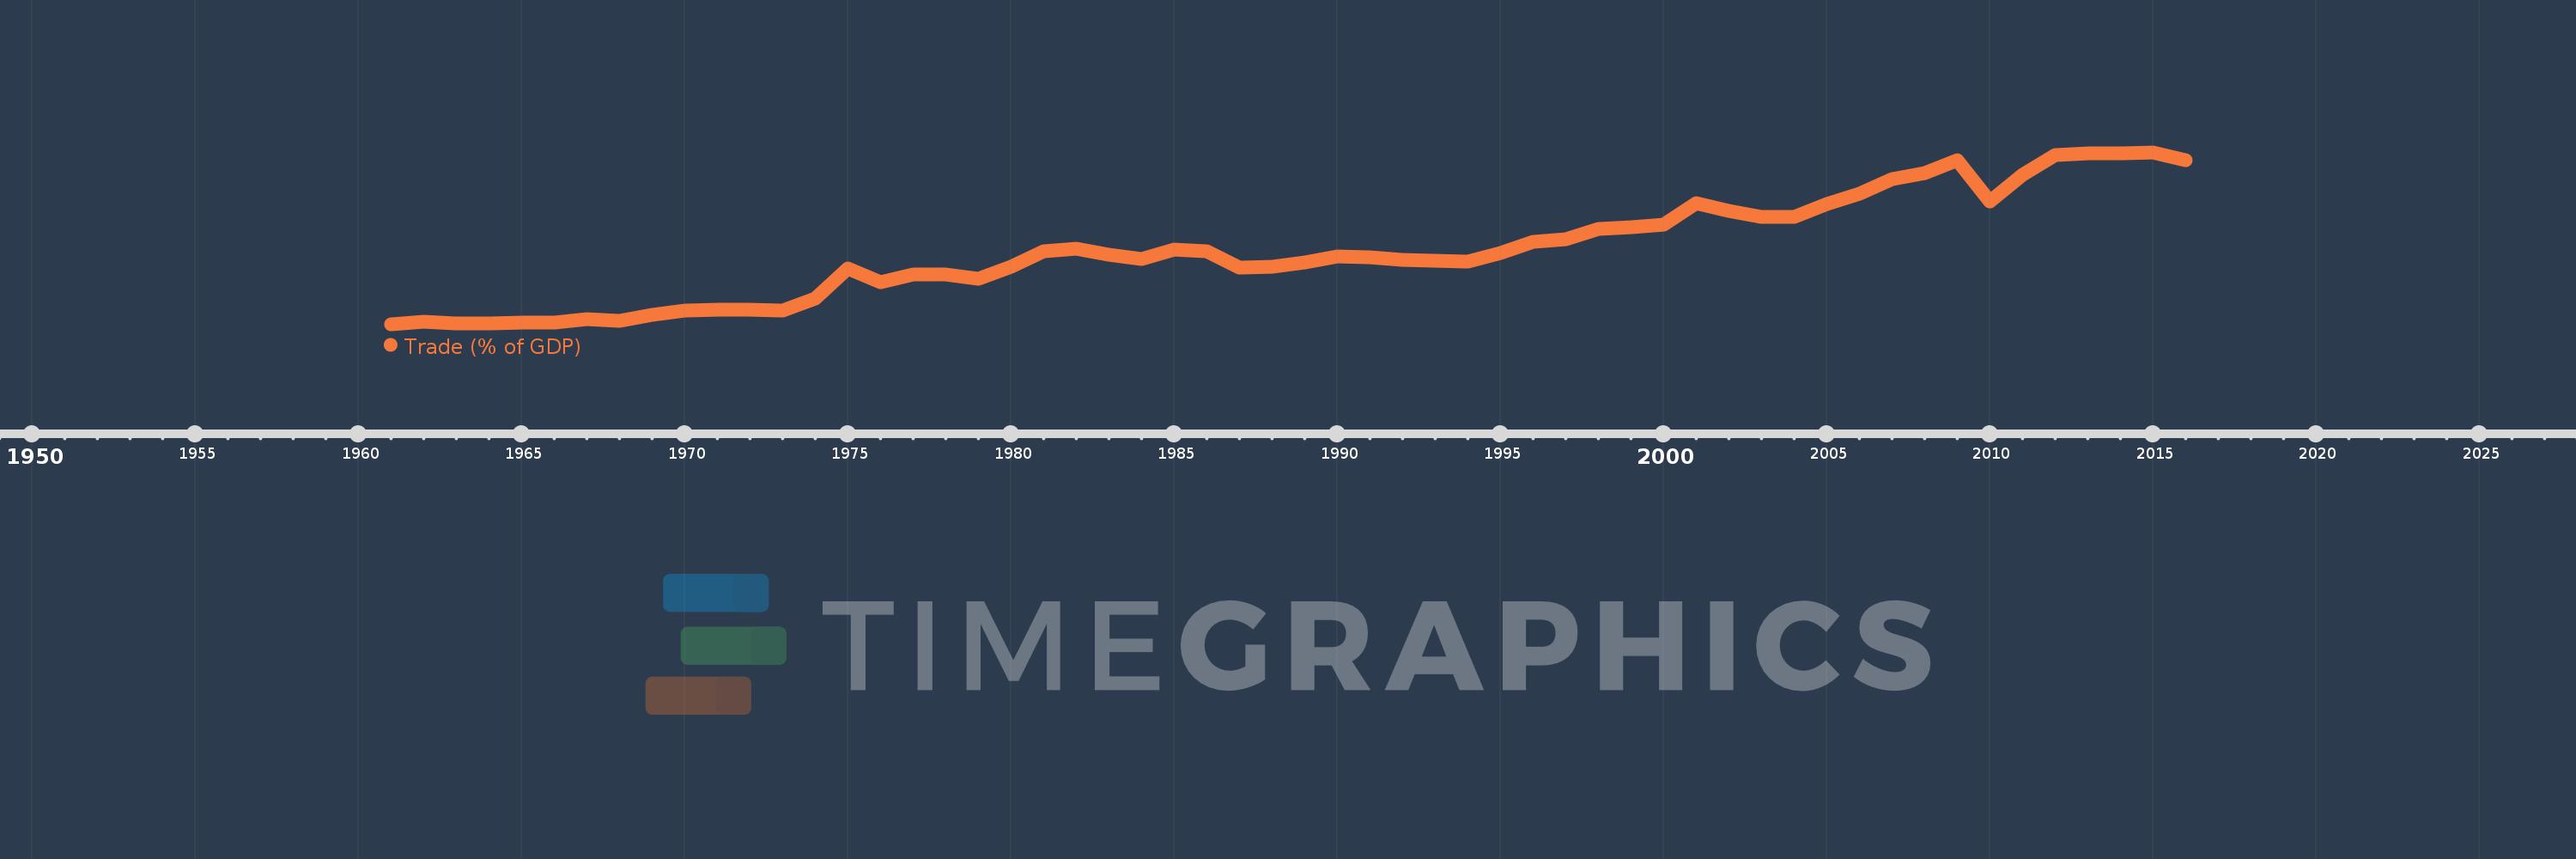
Post-demographic dividend
PST
false
2
1
Trade (% of GDP)
2016,2015,2014,2013,2012,2011,2010,2009,2008,2007,2006,2005,2004,2003,2002,2001,2000,1999,1998,1997,1996,1995,1994,1993,1992,1991,1990,1989,1988,1987,1986,1985,1984,1983,1982,1981,1980,1979,1978,1977,1976,1975,1974,1973,1972,1971,1970,1969,1968,1967,1966,1965,1964,1963,1962,1961
This statistics in other country:
AfghanistanAlbaniaAlgeriaAngolaAntigua and BarbudaArab WorldArgentinaArmeniaArubaAustraliaAustriaAzerbaijanBahamas, TheBahrainBangladeshBarbadosBelarusBelgiumBelizeBeninBermudaBhutanBoliviaBosnia and HerzegovinaBotswanaBrazilBrunei DarussalamBulgariaBurkina FasoBurundiCabo VerdeCambodiaCameroonCanadaCaribbean small statesCentral African RepublicCentral Europe and the BalticsChadChileChinaColombiaComorosCongo, Dem. Rep.Congo, Rep.Costa RicaCote d'IvoireCroatiaCubaCyprusCzech RepublicDenmarkDjiboutiDominicaDominican RepublicEarly-demographic dividendEast Asia & PacificEast Asia & Pacific (excluding high income)East Asia & Pacific (IDA & IBRD countries)EcuadorEgypt, Arab Rep.El SalvadorEquatorial GuineaEritreaEstoniaEthiopiaEuro areaEurope & Central AsiaEurope & Central Asia (excluding high income)Europe & Central Asia (IDA & IBRD countries)European UnionFaroe IslandsFijiFinlandFragile and conflict affected situationsFranceFrench PolynesiaGabonGambia, TheGeorgiaGermanyGhanaGreeceGrenadaGuatemalaGuineaGuinea-BissauGuyanaHaitiHeavily indebted poor countries (HIPC)High incomeHondurasHong Kong SAR, ChinaHungaryIBRD onlyIcelandIDA & IBRD totalIDA blendIDA onlyIDA totalIndiaIndonesiaIran, Islamic Rep.IraqIrelandIsraelItalyJamaicaJapanJordanKazakhstanKenyaKiribatiKorea, Rep.KosovoKuwaitKyrgyz RepublicLao PDRLate-demographic dividendLatin America & Caribbean Latin America & Caribbean (excluding high income)Latin America & the Caribbean (IDA & IBRD countries)LatviaLeast developed countries: UN classificationLebanonLesothoLiberiaLibyaLithuaniaLow & middle incomeLow incomeLower middle incomeLuxembourgMacao SAR, ChinaMacedonia, FYRMadagascarMalawiMalaysiaMaldivesMaliMaltaMauritaniaMauritiusMexicoMicronesia, Fed. Sts.Middle East & North AfricaMiddle East & North Africa (excluding high income)Middle East & North Africa (IDA & IBRD countries)Middle incomeMoldovaMongoliaMontenegroMoroccoMozambiqueMyanmarNamibiaNepalNetherlandsNew CaledoniaNew ZealandNicaraguaNigerNigeriaNorth AmericaNorwayOECD membersOmanOther small statesPacific island small statesPakistanPalauPanamaPapua New GuineaParaguayPeruPhilippinesPolandPortugalPost-demographic dividendPre-demographic dividendPuerto RicoQatarRomaniaRussian FederationRwandaSamoaSaudi ArabiaSenegalSerbiaSeychellesSierra LeoneSingaporeSlovak RepublicSloveniaSmall statesSolomon IslandsSomaliaSouth AfricaSouth AsiaSouth Asia (IDA & IBRD)South SudanSpainSri LankaSt. Kitts and NevisSt. LuciaSt. Vincent and the GrenadinesSub-Saharan Africa Sub-Saharan Africa (excluding high income)Sub-Saharan Africa (IDA & IBRD countries)SudanSurinameSwazilandSwedenSwitzerlandSyrian Arab RepublicTajikistanTanzaniaThailandTimor-LesteTogoTongaTrinidad and TobagoTunisiaTurkeyTurkmenistanUgandaUkraineUnited Arab EmiratesUnited KingdomUnited StatesUpper middle incomeUruguayUzbekistanVanuatuVenezuela, RBVietnamWest Bank and GazaWorldYemen, Rep.ZambiaZimbabwe Timeline:
This timeline shows a graph from 1961 to 2016 of Post-demographic dividend. No data until 1960. Number of actual observations by date: 56.
Source name:
World Development Indicators
Source organization:
World Bank national accounts data, and OECD National Accounts data files.
Categories, topics:
Economy & Growth, Trade
Last updated:
apr 23, 2017
Indicators value changes by year
Minimum:
25.553
jan 1, 1961
Maximum:
60.085
jan 1, 2015
At the date of observation
Value
Absolute change
Change from previous value
jan 1, 1961
25.553
+25.553
0.0%
jan 1, 1962
26.136
+0.584
2.28%
jan 1, 1963
25.657
-0.479
-1.83%
jan 1, 1964
25.791
+0.134
0.52%
jan 1, 1965
25.922
+0.131
0.51%
jan 1, 1966
25.966
+0.044
0.17%
jan 1, 1967
26.532
+0.567
2.18%
jan 1, 1968
26.254
-0.278
-1.05%
jan 1, 1969
27.386
+1.132
4.31%
jan 1, 1970
28.273
+0.887
3.24%
jan 1, 1971
28.536
+0.263
0.93%
jan 1, 1972
28.444
-0.092
-0.32%
jan 1, 1973
28.254
-0.19
-0.67%
jan 1, 1974
30.797
+2.542
9.0%
jan 1, 1975
36.7
+5.903
19.17%
jan 1, 1976
34.043
-2.657
-7.24%
jan 1, 1977
35.471
+1.428
4.2%
jan 1, 1978
35.59
+0.119
0.33%
jan 1, 1979
34.736
-0.853
-2.4%
jan 1, 1980
37.144
+2.407
6.93%
jan 1, 1981
40.254
+3.111
8.37%
jan 1, 1982
40.725
+0.471
1.17%
jan 1, 1983
39.479
-1.246
-3.06%
jan 1, 1984
38.701
-0.778
-1.97%
jan 1, 1985
40.59
+1.889
4.88%
jan 1, 1986
40.132
-0.459
-1.13%
jan 1, 1987
36.881
-3.25
-8.1%
jan 1, 1988
37.053
+0.172
0.47%
jan 1, 1989
37.924
+0.87
2.35%
jan 1, 1990
39.126
+1.203
3.17%
jan 1, 1991
39.075
-0.051
-0.13%
jan 1, 1992
38.488
-0.586
-1.5%
jan 1, 1993
38.258
-0.23
-0.6%
jan 1, 1994
38.088
-0.171
-0.45%
jan 1, 1995
39.832
+1.744
4.58%
jan 1, 1996
42.161
+2.33
5.85%
jan 1, 1997
42.706
+0.545
1.29%
jan 1, 1998
44.714
+2.008
4.7%
jan 1, 1999
45.058
+0.344
0.77%
jan 1, 2000
45.51
+0.452
1.0%
jan 1, 2001
49.863
+4.353
9.57%
jan 1, 2002
48.409
-1.454
-2.92%
jan 1, 2003
47.08
-1.329
-2.75%
jan 1, 2004
47.047
-0.033
-0.07%
jan 1, 2005
49.626
+2.579
5.48%
jan 1, 2006
51.84
+2.214
4.46%
jan 1, 2007
54.775
+2.935
5.66%
jan 1, 2008
55.901
+1.125
2.05%
jan 1, 2009
58.454
+2.553
4.57%
jan 1, 2010
50.259
-8.195
-14.02%
jan 1, 2011
55.517
+5.258
10.46%
jan 1, 2012
59.516
+3.999
7.2%
jan 1, 2013
59.937
+0.42
0.71%
jan 1, 2014
59.922
-0.014
-0.02%
jan 1, 2015
60.085
+0.163
0.27%
jan 1, 2016
58.585
-1.5
-2.5%
Ranking of countries by current statistics by years


Comments: