29
/
en
AIzaSyAYiBZKx7MnpbEhh9jyipgxe19OcubqV5w
April 1, 2024
50526
Middle East & North Africa (IDA & IBRD countries)
TMN
false
2
1
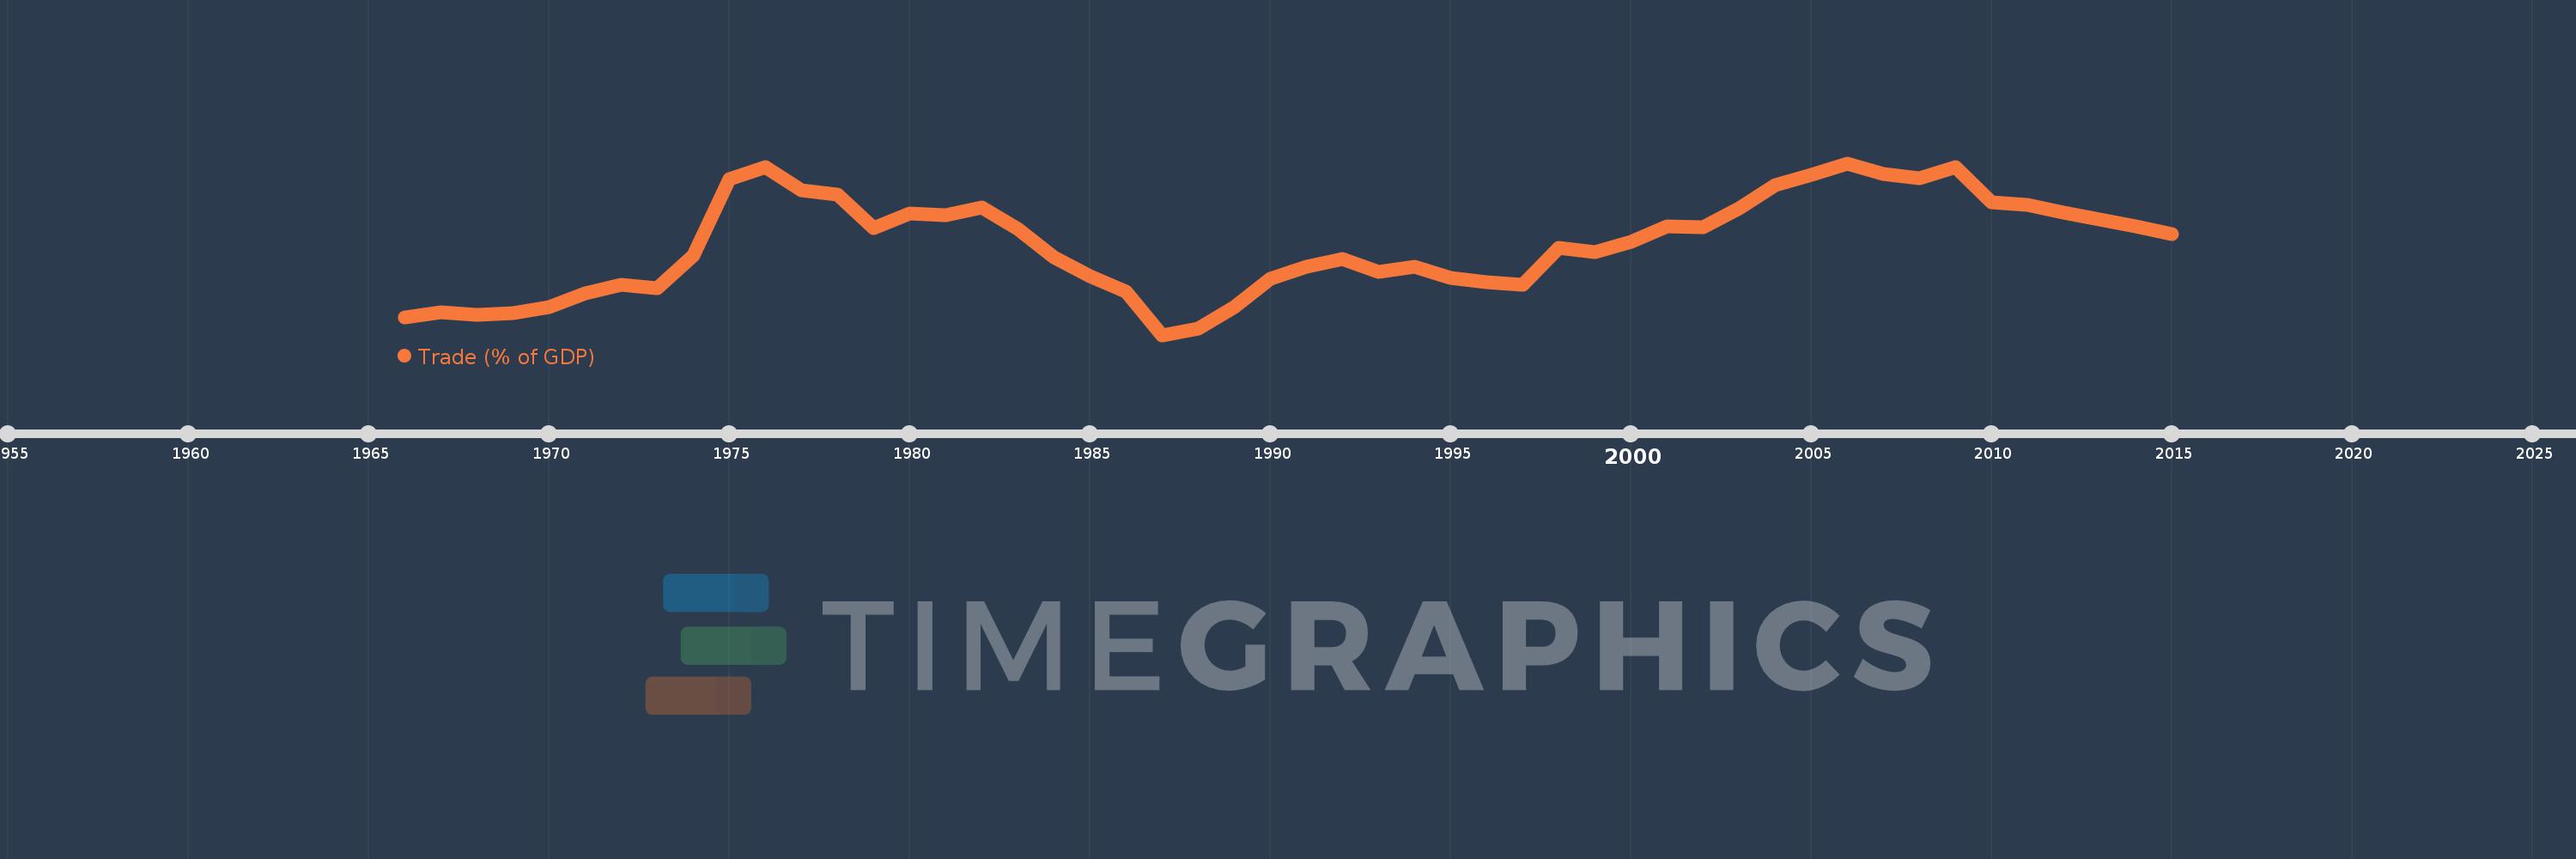
Trade (% of GDP)
2015,2014,2013,2012,2011,2010,2009,2008,2007,2006,2005,2004,2003,2002,2001,2000,1999,1998,1997,1996,1995,1994,1993,1992,1991,1990,1989,1988,1987,1986,1985,1984,1983,1982,1981,1980,1979,1978,1977,1976,1975,1974,1973,1972,1971,1970,1969,1968,1967,1966
This statistics in other country:
AfghanistanAlbaniaAlgeriaAngolaAntigua and BarbudaArab WorldArgentinaArmeniaArubaAustraliaAustriaAzerbaijanBahamas, TheBahrainBangladeshBarbadosBelarusBelgiumBelizeBeninBermudaBhutanBoliviaBosnia and HerzegovinaBotswanaBrazilBrunei DarussalamBulgariaBurkina FasoBurundiCabo VerdeCambodiaCameroonCanadaCaribbean small statesCentral African RepublicCentral Europe and the BalticsChadChileChinaColombiaComorosCongo, Dem. Rep.Congo, Rep.Costa RicaCote d'IvoireCroatiaCubaCyprusCzech RepublicDenmarkDjiboutiDominicaDominican RepublicEarly-demographic dividendEast Asia & PacificEast Asia & Pacific (excluding high income)East Asia & Pacific (IDA & IBRD countries)EcuadorEgypt, Arab Rep.El SalvadorEquatorial GuineaEritreaEstoniaEthiopiaEuro areaEurope & Central AsiaEurope & Central Asia (excluding high income)Europe & Central Asia (IDA & IBRD countries)European UnionFaroe IslandsFijiFinlandFragile and conflict affected situationsFranceFrench PolynesiaGabonGambia, TheGeorgiaGermanyGhanaGreeceGrenadaGuatemalaGuineaGuinea-BissauGuyanaHaitiHeavily indebted poor countries (HIPC)High incomeHondurasHong Kong SAR, ChinaHungaryIBRD onlyIcelandIDA & IBRD totalIDA blendIDA onlyIDA totalIndiaIndonesiaIran, Islamic Rep.IraqIrelandIsraelItalyJamaicaJapanJordanKazakhstanKenyaKiribatiKorea, Rep.KosovoKuwaitKyrgyz RepublicLao PDRLate-demographic dividendLatin America & Caribbean Latin America & Caribbean (excluding high income)Latin America & the Caribbean (IDA & IBRD countries)LatviaLeast developed countries: UN classificationLebanonLesothoLiberiaLibyaLithuaniaLow & middle incomeLow incomeLower middle incomeLuxembourgMacao SAR, ChinaMacedonia, FYRMadagascarMalawiMalaysiaMaldivesMaliMaltaMauritaniaMauritiusMexicoMicronesia, Fed. Sts.Middle East & North AfricaMiddle East & North Africa (excluding high income)Middle East & North Africa (IDA & IBRD countries)Middle incomeMoldovaMongoliaMontenegroMoroccoMozambiqueMyanmarNamibiaNepalNetherlandsNew CaledoniaNew ZealandNicaraguaNigerNigeriaNorth AmericaNorwayOECD membersOmanOther small statesPacific island small statesPakistanPalauPanamaPapua New GuineaParaguayPeruPhilippinesPolandPortugalPost-demographic dividendPre-demographic dividendPuerto RicoQatarRomaniaRussian FederationRwandaSamoaSaudi ArabiaSenegalSerbiaSeychellesSierra LeoneSingaporeSlovak RepublicSloveniaSmall statesSolomon IslandsSomaliaSouth AfricaSouth AsiaSouth Asia (IDA & IBRD)South SudanSpainSri LankaSt. Kitts and NevisSt. LuciaSt. Vincent and the GrenadinesSub-Saharan Africa Sub-Saharan Africa (excluding high income)Sub-Saharan Africa (IDA & IBRD countries)SudanSurinameSwazilandSwedenSwitzerlandSyrian Arab RepublicTajikistanTanzaniaThailandTimor-LesteTogoTongaTrinidad and TobagoTunisiaTurkeyTurkmenistanUgandaUkraineUnited Arab EmiratesUnited KingdomUnited StatesUpper middle incomeUruguayUzbekistanVanuatuVenezuela, RBVietnamWest Bank and GazaWorldYemen, Rep.ZambiaZimbabwe Timeline:
This timeline shows a graph from 1966 to 2015 of Middle East & North Africa (IDA & IBRD countries). No data until 1965. Number of actual observations by date: 50.
Source name:
World Development Indicators
Source organization:
World Bank national accounts data, and OECD National Accounts data files.
Categories, topics:
Economy & Growth, Trade
Last updated:
apr 23, 2017
Indicators value changes by year
Minimum:
32.557
jan 1, 1987
Maximum:
73.753
jan 1, 2006
At the date of observation
Value
Absolute change
Change from previous value
jan 1, 1966
36.752
+36.752
0.0%
jan 1, 1967
38.013
+1.261
3.43%
jan 1, 1968
37.307
-0.706
-1.86%
jan 1, 1969
37.74
+0.433
1.16%
jan 1, 1970
39.315
+1.575
4.17%
jan 1, 1971
42.503
+3.188
8.11%
jan 1, 1972
44.614
+2.111
4.97%
jan 1, 1973
43.875
-0.739
-1.66%
jan 1, 1974
51.661
+7.786
17.75%
jan 1, 1975
69.913
+18.252
35.33%
jan 1, 1976
72.763
+2.85
4.08%
jan 1, 1977
67.323
-5.44
-7.48%
jan 1, 1978
66.297
-1.027
-1.52%
jan 1, 1979
58.16
-8.137
-12.27%
jan 1, 1980
61.785
+3.625
6.23%
jan 1, 1981
61.369
-0.416
-0.67%
jan 1, 1982
63.125
+1.757
2.86%
jan 1, 1983
58.051
-5.074
-8.04%
jan 1, 1984
51.301
-6.75
-11.63%
jan 1, 1985
46.672
-4.629
-9.02%
jan 1, 1986
42.983
-3.689
-7.9%
jan 1, 1987
32.557
-10.426
-24.26%
jan 1, 1988
34.085
+1.528
4.69%
jan 1, 1989
39.168
+5.084
14.92%
jan 1, 1990
46.116
+6.947
17.74%
jan 1, 1991
48.872
+2.756
5.98%
jan 1, 1992
50.76
+1.888
3.86%
jan 1, 1993
47.627
-3.132
-6.17%
jan 1, 1994
48.864
+1.237
2.6%
jan 1, 1995
46.231
-2.633
-5.39%
jan 1, 1996
45.32
-0.911
-1.97%
jan 1, 1997
44.631
-0.689
-1.52%
jan 1, 1998
53.426
+8.796
19.71%
jan 1, 1999
52.472
-0.954
-1.79%
jan 1, 2000
54.899
+2.427
4.62%
jan 1, 2001
58.611
+3.712
6.76%
jan 1, 2002
58.35
-0.261
-0.45%
jan 1, 2003
62.973
+4.623
7.92%
jan 1, 2004
68.59
+5.617
8.92%
jan 1, 2005
70.993
+2.404
3.5%
jan 1, 2006
73.753
+2.76
3.89%
jan 1, 2007
71.124
-2.63
-3.57%
jan 1, 2008
70.124
-1.0
-1.41%
jan 1, 2009
72.79
+2.667
3.8%
jan 1, 2010
64.399
-8.392
-11.53%
jan 1, 2011
63.811
-0.588
-0.91%
jan 1, 2012
61.912
-1.899
-2.98%
jan 1, 2013
60.166
-1.746
-2.82%
jan 1, 2014
58.622
-1.544
-2.57%
jan 1, 2015
56.738
-1.884
-3.21%
Ranking of countries by current statistics by years


Comments: