29
/
en
AIzaSyAYiBZKx7MnpbEhh9jyipgxe19OcubqV5w
April 1, 2024
141221
Ghana
GHA
true
2
1
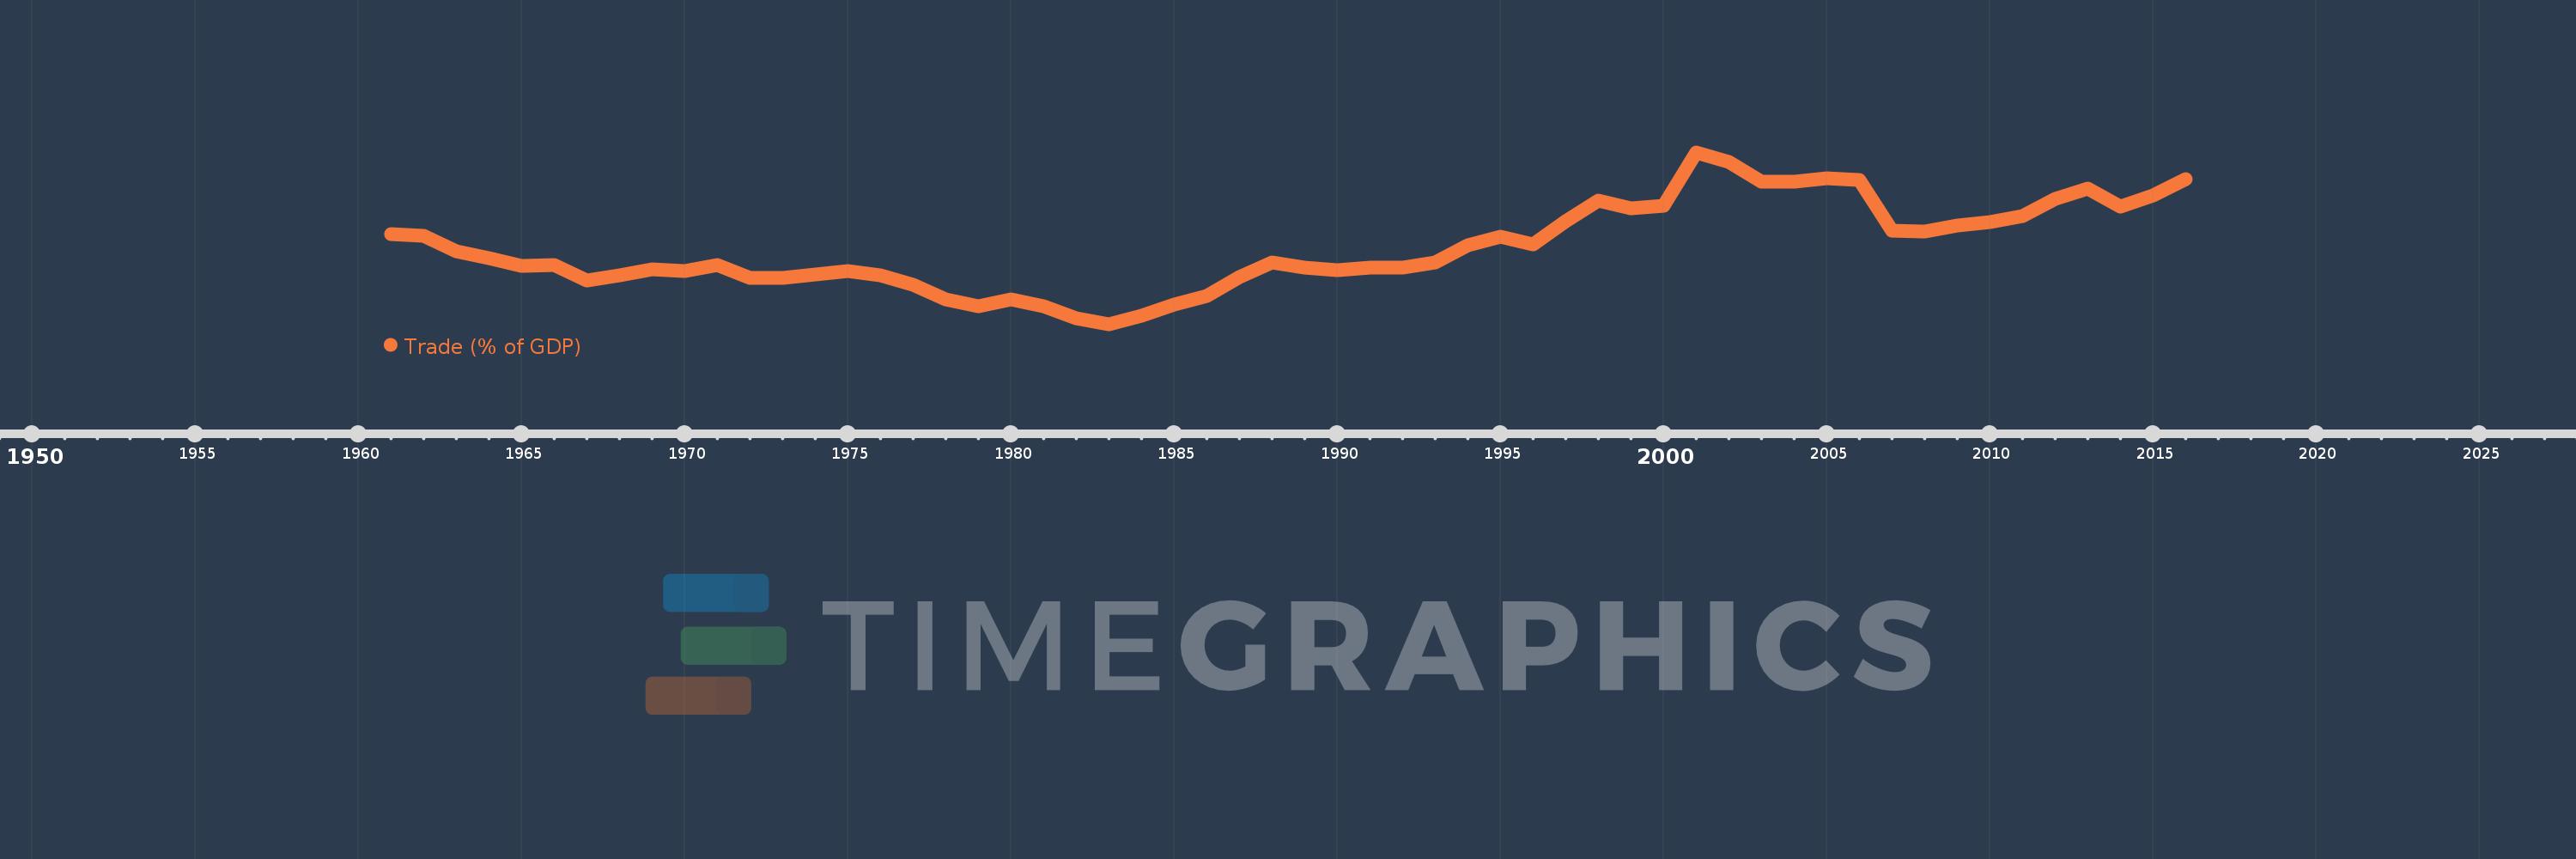
Trade (% of GDP)
2016,2015,2014,2013,2012,2011,2010,2009,2008,2007,2006,2005,2004,2003,2002,2001,2000,1999,1998,1997,1996,1995,1994,1993,1992,1991,1990,1989,1988,1987,1986,1985,1984,1983,1982,1981,1980,1979,1978,1977,1976,1975,1974,1973,1972,1971,1970,1969,1968,1967,1966,1965,1964,1963,1962,1961
This statistics in other country:
AfghanistanAlbaniaAlgeriaAngolaAntigua and BarbudaArab WorldArgentinaArmeniaArubaAustraliaAustriaAzerbaijanBahamas, TheBahrainBangladeshBarbadosBelarusBelgiumBelizeBeninBermudaBhutanBoliviaBosnia and HerzegovinaBotswanaBrazilBrunei DarussalamBulgariaBurkina FasoBurundiCabo VerdeCambodiaCameroonCanadaCaribbean small statesCentral African RepublicCentral Europe and the BalticsChadChileChinaColombiaComorosCongo, Dem. Rep.Congo, Rep.Costa RicaCote d'IvoireCroatiaCubaCyprusCzech RepublicDenmarkDjiboutiDominicaDominican RepublicEarly-demographic dividendEast Asia & PacificEast Asia & Pacific (excluding high income)East Asia & Pacific (IDA & IBRD countries)EcuadorEgypt, Arab Rep.El SalvadorEquatorial GuineaEritreaEstoniaEthiopiaEuro areaEurope & Central AsiaEurope & Central Asia (excluding high income)Europe & Central Asia (IDA & IBRD countries)European UnionFaroe IslandsFijiFinlandFragile and conflict affected situationsFranceFrench PolynesiaGabonGambia, TheGeorgiaGermanyGhanaGreeceGrenadaGuatemalaGuineaGuinea-BissauGuyanaHaitiHeavily indebted poor countries (HIPC)High incomeHondurasHong Kong SAR, ChinaHungaryIBRD onlyIcelandIDA & IBRD totalIDA blendIDA onlyIDA totalIndiaIndonesiaIran, Islamic Rep.IraqIrelandIsraelItalyJamaicaJapanJordanKazakhstanKenyaKiribatiKorea, Rep.KosovoKuwaitKyrgyz RepublicLao PDRLate-demographic dividendLatin America & Caribbean Latin America & Caribbean (excluding high income)Latin America & the Caribbean (IDA & IBRD countries)LatviaLeast developed countries: UN classificationLebanonLesothoLiberiaLibyaLithuaniaLow & middle incomeLow incomeLower middle incomeLuxembourgMacao SAR, ChinaMacedonia, FYRMadagascarMalawiMalaysiaMaldivesMaliMaltaMauritaniaMauritiusMexicoMicronesia, Fed. Sts.Middle East & North AfricaMiddle East & North Africa (excluding high income)Middle East & North Africa (IDA & IBRD countries)Middle incomeMoldovaMongoliaMontenegroMoroccoMozambiqueMyanmarNamibiaNepalNetherlandsNew CaledoniaNew ZealandNicaraguaNigerNigeriaNorth AmericaNorwayOECD membersOmanOther small statesPacific island small statesPakistanPalauPanamaPapua New GuineaParaguayPeruPhilippinesPolandPortugalPost-demographic dividendPre-demographic dividendPuerto RicoQatarRomaniaRussian FederationRwandaSamoaSaudi ArabiaSenegalSerbiaSeychellesSierra LeoneSingaporeSlovak RepublicSloveniaSmall statesSolomon IslandsSomaliaSouth AfricaSouth AsiaSouth Asia (IDA & IBRD)South SudanSpainSri LankaSt. Kitts and NevisSt. LuciaSt. Vincent and the GrenadinesSub-Saharan Africa Sub-Saharan Africa (excluding high income)Sub-Saharan Africa (IDA & IBRD countries)SudanSurinameSwazilandSwedenSwitzerlandSyrian Arab RepublicTajikistanTanzaniaThailandTimor-LesteTogoTongaTrinidad and TobagoTunisiaTurkeyTurkmenistanUgandaUkraineUnited Arab EmiratesUnited KingdomUnited StatesUpper middle incomeUruguayUzbekistanVanuatuVenezuela, RBVietnamWest Bank and GazaWorldYemen, Rep.ZambiaZimbabwe Timeline:
This timeline shows a graph from 1961 to 2016 of Ghana. No data until 1960. Number of actual observations by date: 56.
Source name:
World Development Indicators
Source organization:
World Bank national accounts data, and OECD National Accounts data files.
Categories, topics:
Economy & Growth, Trade
Last updated:
apr 23, 2017
Indicators value changes by year
Maximum:
116.048
jan 1, 2001
At the date of observation
Value
Absolute change
Change from previous value
jan 1, 1961
63.636
+63.636
0.0%
jan 1, 1962
62.581
-1.056
-1.66%
jan 1, 1963
52.685
-9.896
-15.81%
jan 1, 1964
48.636
-4.049
-7.68%
jan 1, 1965
43.77
-4.866
-10.01%
jan 1, 1966
43.861
+0.091
0.21%
jan 1, 1967
34.256
-9.605
-21.9%
jan 1, 1968
37.367
+3.111
9.08%
jan 1, 1969
41.176
+3.809
10.19%
jan 1, 1970
40.08
-1.097
-2.66%
jan 1, 1971
44.046
+3.966
9.9%
jan 1, 1972
36.0
-8.046
-18.27%
jan 1, 1973
35.915
-0.085
-0.24%
jan 1, 1974
37.846
+1.932
5.38%
jan 1, 1975
40.129
+2.282
6.03%
jan 1, 1976
37.8
-2.328
-5.8%
jan 1, 1977
31.75
-6.051
-16.01%
jan 1, 1978
22.046
-9.704
-30.56%
jan 1, 1979
18.045
-4.001
-18.15%
jan 1, 1980
22.394
+4.349
24.1%
jan 1, 1981
17.621
-4.773
-21.31%
jan 1, 1982
10.079
-7.542
-42.8%
jan 1, 1983
6.32
-3.759
-37.29%
jan 1, 1984
11.545
+5.225
82.66%
jan 1, 1985
18.815
+7.27
62.97%
jan 1, 1986
24.244
+5.429
28.86%
jan 1, 1987
36.712
+12.468
51.43%
jan 1, 1988
45.848
+9.136
24.89%
jan 1, 1989
42.245
-3.603
-7.86%
jan 1, 1990
41.086
-1.16
-2.74%
jan 1, 1991
42.728
+1.642
4.0%
jan 1, 1992
42.488
-0.24
-0.56%
jan 1, 1993
45.994
+3.505
8.25%
jan 1, 1994
56.669
+10.676
23.21%
jan 1, 1995
62.021
+5.352
9.44%
jan 1, 1996
57.423
-4.598
-7.41%
jan 1, 1997
72.205
+14.782
25.74%
jan 1, 1998
85.402
+13.197
18.28%
jan 1, 1999
80.6
-4.802
-5.62%
jan 1, 2000
81.705
+1.106
1.37%
jan 1, 2001
116.048
+34.343
42.03%
jan 1, 2002
110.046
-6.003
-5.17%
jan 1, 2003
97.489
-12.557
-11.41%
jan 1, 2004
97.287
-0.202
-0.21%
jan 1, 2005
99.67
+2.383
2.45%
jan 1, 2006
98.172
-1.499
-1.5%
jan 1, 2007
65.923
-32.249
-32.85%
jan 1, 2008
65.354
-0.568
-0.86%
jan 1, 2009
69.514
+4.16
6.37%
jan 1, 2010
71.595
+2.081
2.99%
jan 1, 2011
75.378
+3.783
5.28%
jan 1, 2012
86.295
+10.918
14.48%
jan 1, 2013
93.168
+6.873
7.96%
jan 1, 2014
81.652
-11.516
-12.36%
jan 1, 2015
88.451
+6.799
8.33%
jan 1, 2016
99.248
+10.797
12.21%
Ranking of countries by current statistics by years


Comments: