29
/
en
AIzaSyAYiBZKx7MnpbEhh9jyipgxe19OcubqV5w
April 1, 2024
217262
Pakistan
PAK
true
2
1
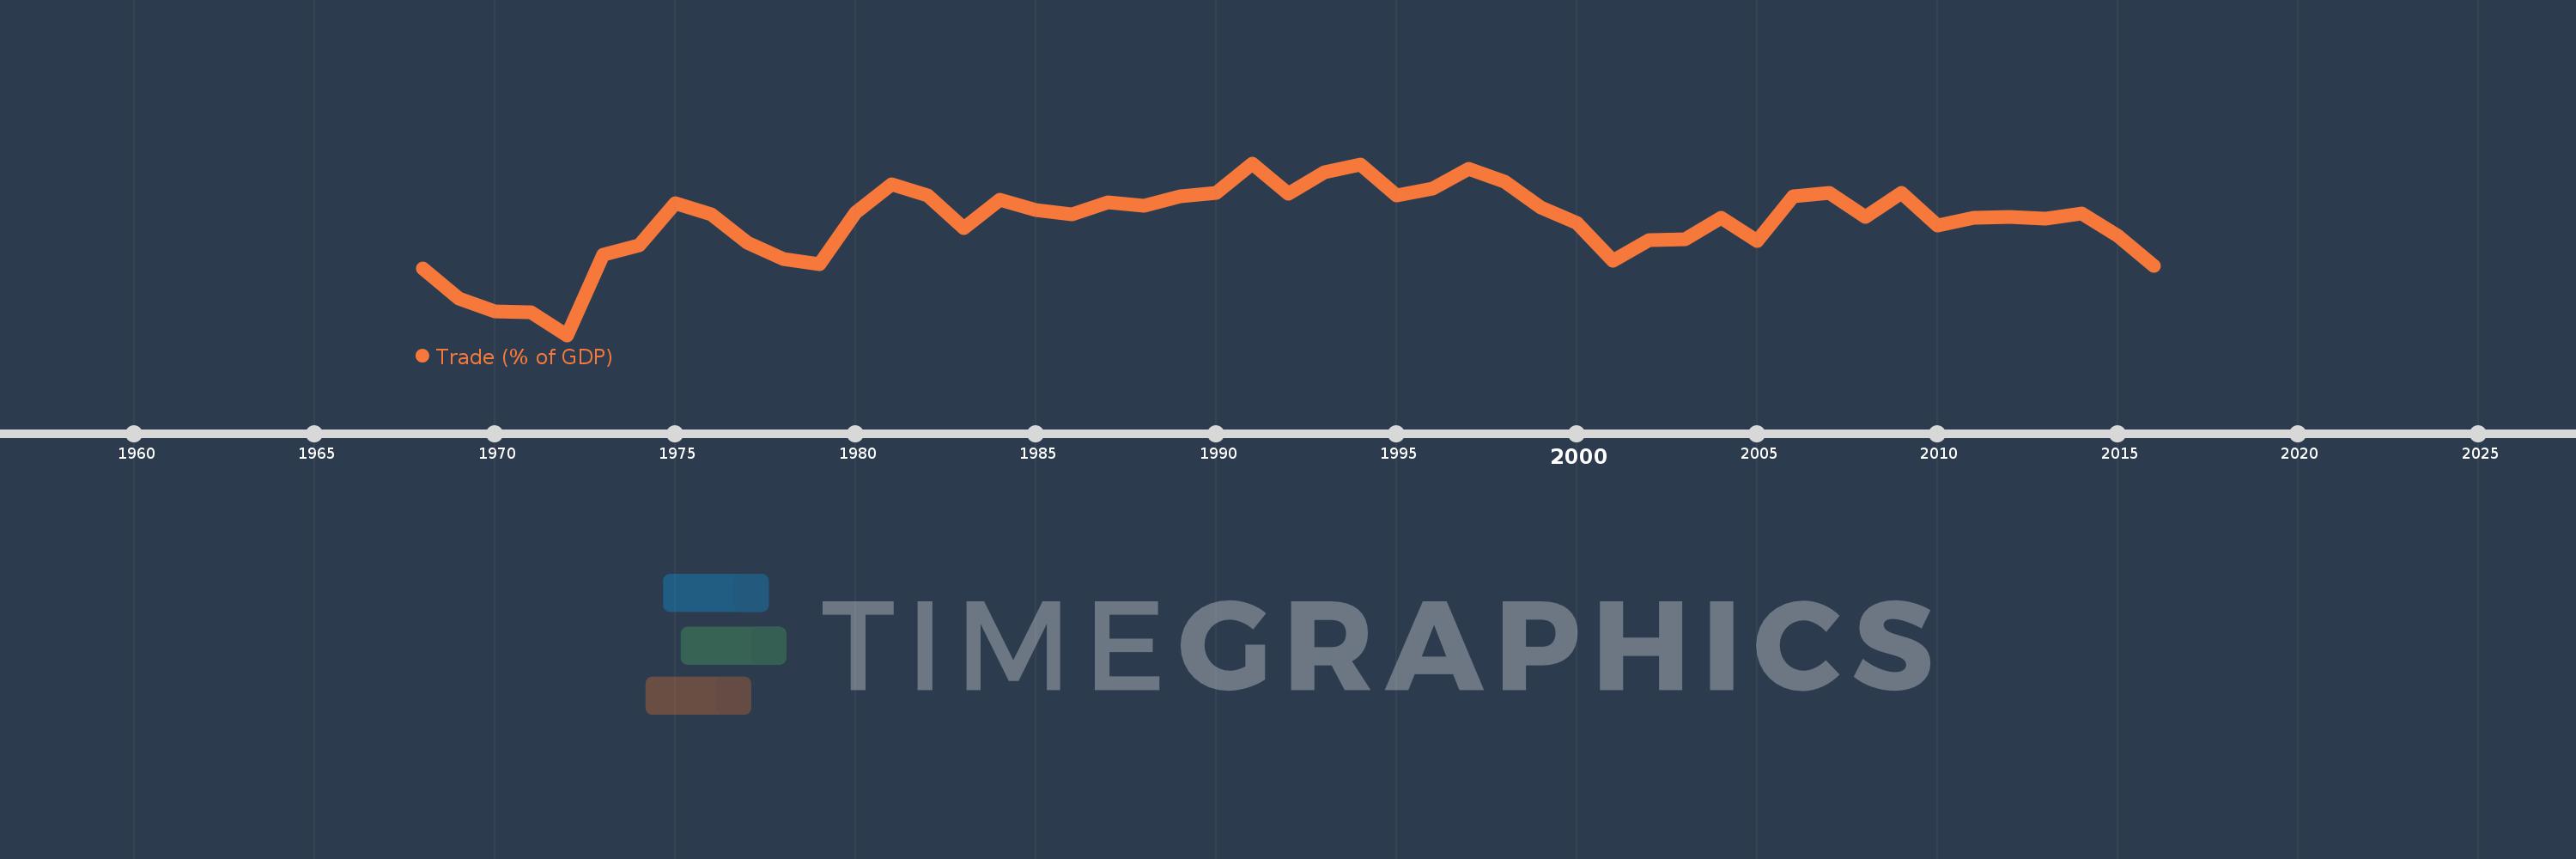
Trade (% of GDP)
2016,2015,2014,2013,2012,2011,2010,2009,2008,2007,2006,2005,2004,2003,2002,2001,2000,1999,1998,1997,1996,1995,1994,1993,1992,1991,1990,1989,1988,1987,1986,1985,1984,1983,1982,1981,1980,1979,1978,1977,1976,1975,1974,1973,1972,1971,1970,1969,1968
This statistics in other country:
AfghanistanAlbaniaAlgeriaAngolaAntigua and BarbudaArab WorldArgentinaArmeniaArubaAustraliaAustriaAzerbaijanBahamas, TheBahrainBangladeshBarbadosBelarusBelgiumBelizeBeninBermudaBhutanBoliviaBosnia and HerzegovinaBotswanaBrazilBrunei DarussalamBulgariaBurkina FasoBurundiCabo VerdeCambodiaCameroonCanadaCaribbean small statesCentral African RepublicCentral Europe and the BalticsChadChileChinaColombiaComorosCongo, Dem. Rep.Congo, Rep.Costa RicaCote d'IvoireCroatiaCubaCyprusCzech RepublicDenmarkDjiboutiDominicaDominican RepublicEarly-demographic dividendEast Asia & PacificEast Asia & Pacific (excluding high income)East Asia & Pacific (IDA & IBRD countries)EcuadorEgypt, Arab Rep.El SalvadorEquatorial GuineaEritreaEstoniaEthiopiaEuro areaEurope & Central AsiaEurope & Central Asia (excluding high income)Europe & Central Asia (IDA & IBRD countries)European UnionFaroe IslandsFijiFinlandFragile and conflict affected situationsFranceFrench PolynesiaGabonGambia, TheGeorgiaGermanyGhanaGreeceGrenadaGuatemalaGuineaGuinea-BissauGuyanaHaitiHeavily indebted poor countries (HIPC)High incomeHondurasHong Kong SAR, ChinaHungaryIBRD onlyIcelandIDA & IBRD totalIDA blendIDA onlyIDA totalIndiaIndonesiaIran, Islamic Rep.IraqIrelandIsraelItalyJamaicaJapanJordanKazakhstanKenyaKiribatiKorea, Rep.KosovoKuwaitKyrgyz RepublicLao PDRLate-demographic dividendLatin America & Caribbean Latin America & Caribbean (excluding high income)Latin America & the Caribbean (IDA & IBRD countries)LatviaLeast developed countries: UN classificationLebanonLesothoLiberiaLibyaLithuaniaLow & middle incomeLow incomeLower middle incomeLuxembourgMacao SAR, ChinaMacedonia, FYRMadagascarMalawiMalaysiaMaldivesMaliMaltaMauritaniaMauritiusMexicoMicronesia, Fed. Sts.Middle East & North AfricaMiddle East & North Africa (excluding high income)Middle East & North Africa (IDA & IBRD countries)Middle incomeMoldovaMongoliaMontenegroMoroccoMozambiqueMyanmarNamibiaNepalNetherlandsNew CaledoniaNew ZealandNicaraguaNigerNigeriaNorth AmericaNorwayOECD membersOmanOther small statesPacific island small statesPakistanPalauPanamaPapua New GuineaParaguayPeruPhilippinesPolandPortugalPost-demographic dividendPre-demographic dividendPuerto RicoQatarRomaniaRussian FederationRwandaSamoaSaudi ArabiaSenegalSerbiaSeychellesSierra LeoneSingaporeSlovak RepublicSloveniaSmall statesSolomon IslandsSomaliaSouth AfricaSouth AsiaSouth Asia (IDA & IBRD)South SudanSpainSri LankaSt. Kitts and NevisSt. LuciaSt. Vincent and the GrenadinesSub-Saharan Africa Sub-Saharan Africa (excluding high income)Sub-Saharan Africa (IDA & IBRD countries)SudanSurinameSwazilandSwedenSwitzerlandSyrian Arab RepublicTajikistanTanzaniaThailandTimor-LesteTogoTongaTrinidad and TobagoTunisiaTurkeyTurkmenistanUgandaUkraineUnited Arab EmiratesUnited KingdomUnited StatesUpper middle incomeUruguayUzbekistanVanuatuVenezuela, RBVietnamWest Bank and GazaWorldYemen, Rep.ZambiaZimbabwe Timeline:
This timeline shows a graph from 1968 to 2016 of Pakistan. No data until 1967. Number of actual observations by date: 49.
Source name:
World Development Indicators
Source organization:
World Bank national accounts data, and OECD National Accounts data files.
Categories, topics:
Economy & Growth, Trade
Last updated:
apr 23, 2017
Indicators value changes by year
Minimum:
19.932
jan 1, 1972
Maximum:
38.909
jan 1, 1991
At the date of observation
Value
Absolute change
Change from previous value
jan 1, 1968
27.283
+27.283
0.0%
jan 1, 1969
23.93
-3.353
-12.29%
jan 1, 1970
22.53
-1.4
-5.85%
jan 1, 1971
22.439
-0.091
-0.4%
jan 1, 1972
19.932
-2.506
-11.17%
jan 1, 1973
28.757
+8.825
44.27%
jan 1, 1974
29.83
+1.074
3.73%
jan 1, 1975
34.458
+4.627
15.51%
jan 1, 1976
33.246
-1.212
-3.52%
jan 1, 1977
30.096
-3.15
-9.48%
jan 1, 1978
28.305
-1.79
-5.95%
jan 1, 1979
27.72
-0.586
-2.07%
jan 1, 1980
33.45
+5.73
20.67%
jan 1, 1981
36.587
+3.137
9.38%
jan 1, 1982
35.329
-1.258
-3.44%
jan 1, 1983
31.71
-3.619
-10.24%
jan 1, 1984
34.896
+3.186
10.05%
jan 1, 1985
33.697
-1.2
-3.44%
jan 1, 1986
33.238
-0.459
-1.36%
jan 1, 1987
34.567
+1.33
4.0%
jan 1, 1988
34.238
-0.329
-0.95%
jan 1, 1989
35.257
+1.018
2.97%
jan 1, 1990
35.63
+0.373
1.06%
jan 1, 1991
38.909
+3.279
9.2%
jan 1, 1992
35.555
-3.355
-8.62%
jan 1, 1993
37.888
+2.333
6.56%
jan 1, 1994
38.747
+0.859
2.27%
jan 1, 1995
35.327
-3.42
-8.83%
jan 1, 1996
36.133
+0.806
2.28%
jan 1, 1997
38.33
+2.197
6.08%
jan 1, 1998
36.852
-1.478
-3.86%
jan 1, 1999
34.012
-2.841
-7.71%
jan 1, 2000
32.32
-1.692
-4.97%
jan 1, 2001
28.13
-4.19
-12.97%
jan 1, 2002
30.372
+2.242
7.97%
jan 1, 2003
30.538
+0.166
0.55%
jan 1, 2004
32.844
+2.307
7.55%
jan 1, 2005
30.3
-2.544
-7.75%
jan 1, 2006
35.253
+4.953
16.35%
jan 1, 2007
35.682
+0.428
1.22%
jan 1, 2008
32.99
-2.691
-7.54%
jan 1, 2009
35.594
+2.604
7.89%
jan 1, 2010
32.072
-3.522
-9.9%
jan 1, 2011
32.869
+0.797
2.49%
jan 1, 2012
32.94
+0.071
0.22%
jan 1, 2013
32.806
-0.134
-0.41%
jan 1, 2014
33.334
+0.528
1.61%
jan 1, 2015
30.901
-2.432
-7.3%
jan 1, 2016
27.604
-3.297
-10.67%
Ranking of countries by current statistics by years


Comments: