29
/
en
AIzaSyAYiBZKx7MnpbEhh9jyipgxe19OcubqV5w
April 1, 2024
75239
Azerbaijan
AZE
true
2
1
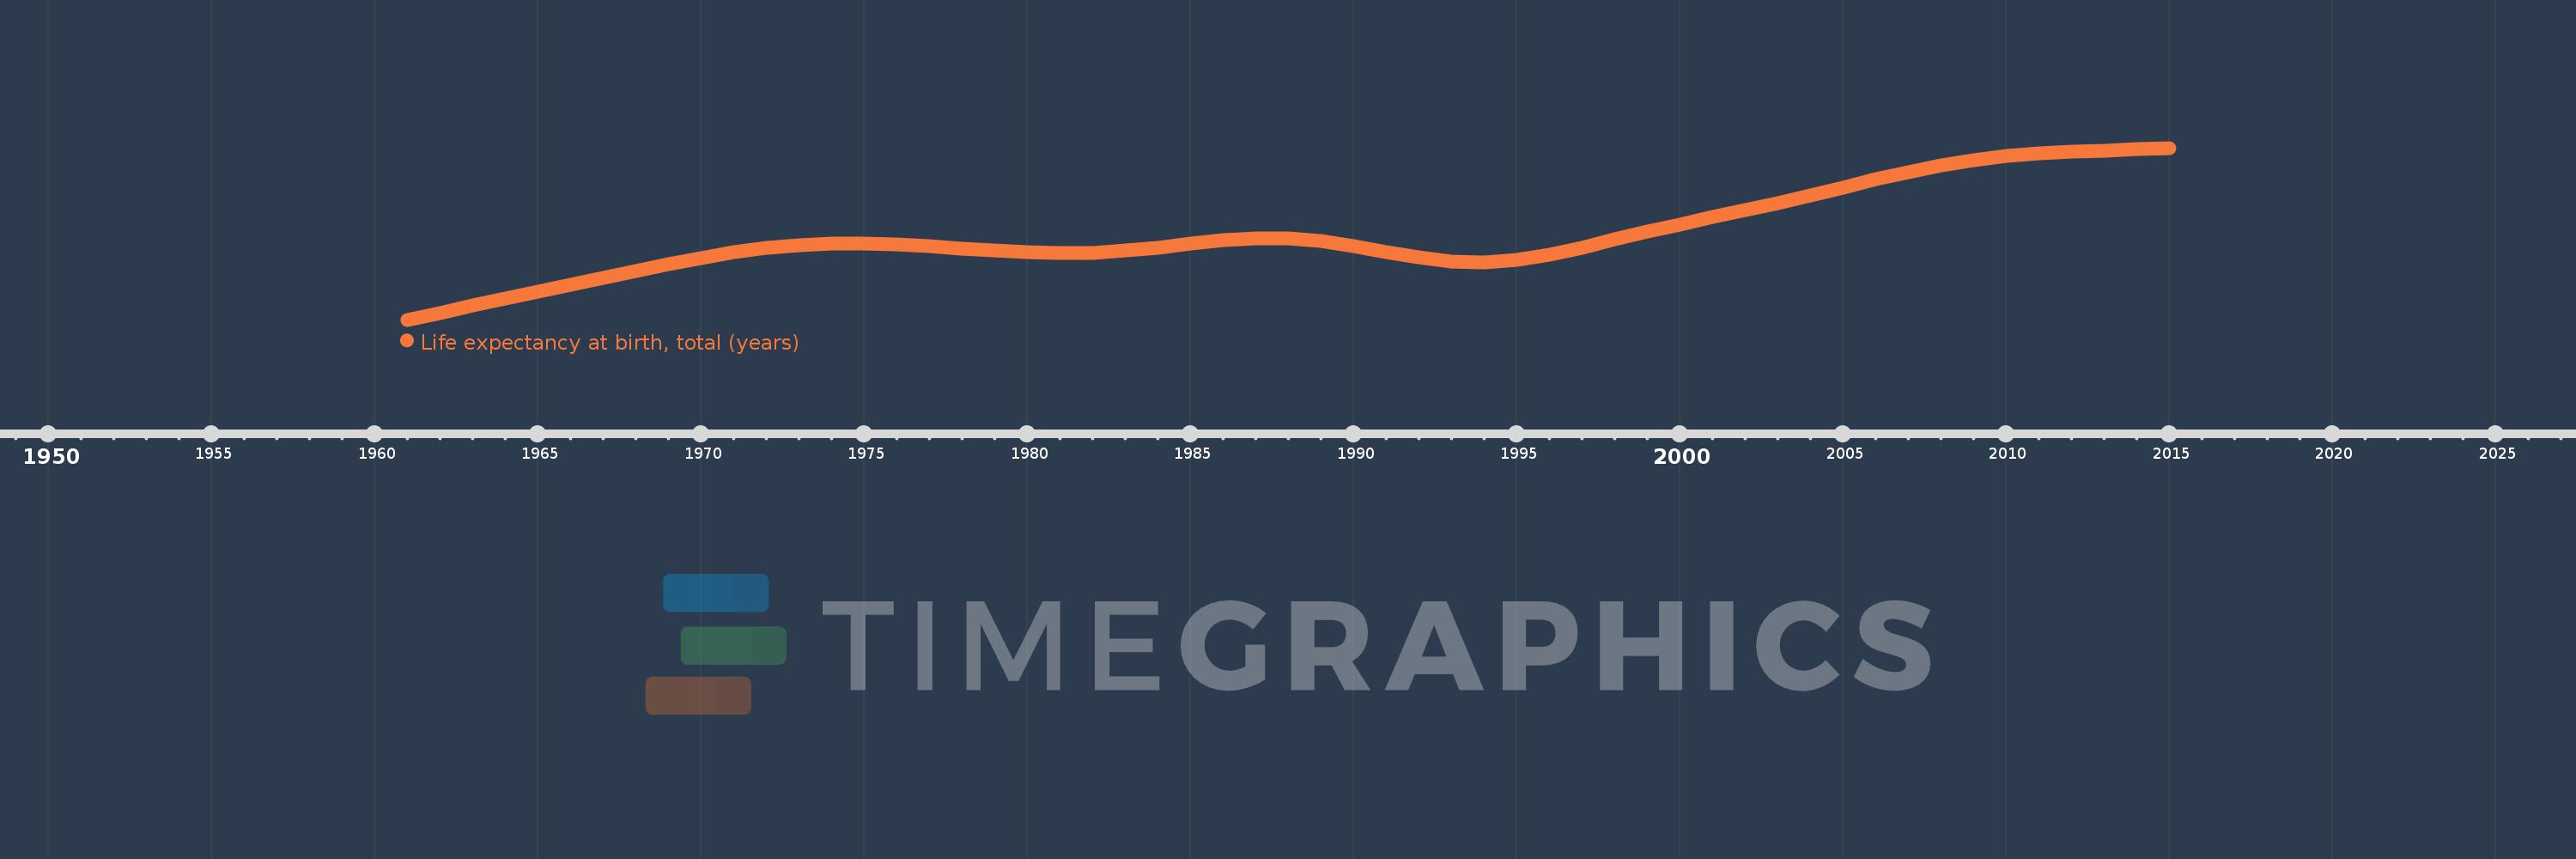
Life expectancy at birth, total (years)
2015,2014,2013,2012,2011,2010,2009,2008,2007,2006,2005,2004,2003,2002,2001,2000,1999,1998,1997,1996,1995,1994,1993,1992,1991,1990,1989,1988,1987,1986,1985,1984,1983,1982,1981,1980,1979,1978,1977,1976,1975,1974,1973,1972,1971,1970,1969,1968,1967,1966,1965,1964,1963,1962,1961
This statistics in other country:
AfghanistanAlbaniaAlgeriaAngolaAntigua and BarbudaArab WorldArgentinaArmeniaArubaAustraliaAustriaAzerbaijanBahamas, TheBahrainBangladeshBarbadosBelarusBelgiumBelizeBeninBermudaBhutanBoliviaBosnia and HerzegovinaBotswanaBrazilBrunei DarussalamBulgariaBurkina FasoBurundiCabo VerdeCambodiaCameroonCanadaCaribbean small statesCentral African RepublicCentral Europe and the BalticsChadChannel IslandsChileChinaColombiaComorosCongo, Dem. Rep.Congo, Rep.Costa RicaCote d'IvoireCroatiaCubaCuracaoCyprusCzech RepublicDenmarkDjiboutiDominicaDominican RepublicEarly-demographic dividendEast Asia & PacificEast Asia & Pacific (excluding high income)East Asia & Pacific (IDA & IBRD countries)EcuadorEgypt, Arab Rep.El SalvadorEquatorial GuineaEritreaEstoniaEthiopiaEuro areaEurope & Central AsiaEurope & Central Asia (excluding high income)Europe & Central Asia (IDA & IBRD countries)European UnionFaroe IslandsFijiFinlandFragile and conflict affected situationsFranceFrench PolynesiaGabonGambia, TheGeorgiaGermanyGhanaGreeceGreenlandGrenadaGuamGuatemalaGuineaGuinea-BissauGuyanaHaitiHeavily indebted poor countries (HIPC)High incomeHondurasHong Kong SAR, ChinaHungaryIBRD onlyIcelandIDA & IBRD totalIDA blendIDA onlyIDA totalIndiaIndonesiaIran, Islamic Rep.IraqIrelandIsle of ManIsraelItalyJamaicaJapanJordanKazakhstanKenyaKiribatiKorea, Dem. People’s Rep.Korea, Rep.KosovoKuwaitKyrgyz RepublicLao PDRLate-demographic dividendLatin America & Caribbean Latin America & Caribbean (excluding high income)Latin America & the Caribbean (IDA & IBRD countries)LatviaLeast developed countries: UN classificationLebanonLesothoLiberiaLibyaLiechtensteinLithuaniaLow & middle incomeLow incomeLower middle incomeLuxembourgMacao SAR, ChinaMacedonia, FYRMadagascarMalawiMalaysiaMaldivesMaliMaltaMarshall IslandsMauritaniaMauritiusMexicoMicronesia, Fed. Sts.Middle East & North AfricaMiddle East & North Africa (excluding high income)Middle East & North Africa (IDA & IBRD countries)Middle incomeMoldovaMongoliaMontenegroMoroccoMozambiqueMyanmarNamibiaNepalNetherlandsNew CaledoniaNew ZealandNicaraguaNigerNigeriaNorth AmericaNorwayOECD membersOmanOther small statesPacific island small statesPakistanPalauPanamaPapua New GuineaParaguayPeruPhilippinesPolandPortugalPost-demographic dividendPre-demographic dividendPuerto RicoQatarRomaniaRussian FederationRwandaSamoaSan MarinoSao Tome and PrincipeSaudi ArabiaSenegalSerbiaSeychellesSierra LeoneSingaporeSint Maarten (Dutch part)Slovak RepublicSloveniaSmall statesSolomon IslandsSomaliaSouth AfricaSouth AsiaSouth Asia (IDA & IBRD)South SudanSpainSri LankaSt. Kitts and NevisSt. LuciaSt. Martin (French part)St. Vincent and the GrenadinesSub-Saharan Africa Sub-Saharan Africa (excluding high income)Sub-Saharan Africa (IDA & IBRD countries)SudanSurinameSwazilandSwedenSwitzerlandSyrian Arab RepublicTajikistanTanzaniaThailandTimor-LesteTogoTongaTrinidad and TobagoTunisiaTurkeyTurkmenistanUgandaUkraineUnited Arab EmiratesUnited KingdomUnited StatesUpper middle incomeUruguayUzbekistanVanuatuVenezuela, RBVietnamVirgin Islands (U.S.)West Bank and GazaWorldYemen, Rep.ZambiaZimbabwe Timeline:
This timeline shows a graph from 1961 to 2015 of Azerbaijan. No data until 1960. Number of actual observations by date: 55.
Source name:
World Development Indicators
Source organization:
Derived from male and female life expectancy at birth from sources such as: (1) United Nations Population Division. World Population Prospects, (2) Census reports and other statistical publications from national statistical offices, (3) Eurostat: Demographic Statistics, (4) United Nations Statistical Division. Population and Vital Statistics Reprot (various years), (5) U.S. Census Bureau: International Database, and (6) Secretariat of the Pacific Community: Statistics and Demography Programme.
Categories, topics:
Health
Last updated:
apr 23, 2017
Indicators value changes by year
Minimum:
60.836
jan 1, 1961
Maximum:
70.763
jan 1, 2015
At the date of observation
Value
Absolute change
Change from previous value
jan 1, 1961
60.836
+60.836
0.0%
jan 1, 1962
61.239
+0.403
0.66%
jan 1, 1963
61.645
+0.405
0.66%
jan 1, 1964
62.052
+0.407
0.66%
jan 1, 1965
62.457
+0.405
0.65%
jan 1, 1966
62.862
+0.404
0.65%
jan 1, 1967
63.267
+0.405
0.64%
jan 1, 1968
63.669
+0.401
0.63%
jan 1, 1969
64.057
+0.388
0.61%
jan 1, 1970
64.419
+0.362
0.57%
jan 1, 1971
64.735
+0.316
0.49%
jan 1, 1972
64.981
+0.247
0.38%
jan 1, 1973
65.148
+0.167
0.26%
jan 1, 1974
65.234
+0.086
0.13%
jan 1, 1975
65.244
+0.009
0.01%
jan 1, 1976
65.187
-0.056
-0.09%
jan 1, 1977
65.082
-0.105
-0.16%
jan 1, 1978
64.953
-0.129
-0.2%
jan 1, 1979
64.829
-0.124
-0.19%
jan 1, 1980
64.728
-0.101
-0.16%
jan 1, 1981
64.681
-0.047
-0.07%
jan 1, 1982
64.716
+0.035
0.05%
jan 1, 1983
64.831
+0.114
0.18%
jan 1, 1984
65.008
+0.177
0.27%
jan 1, 1985
65.226
+0.218
0.34%
jan 1, 1986
65.428
+0.202
0.31%
jan 1, 1987
65.541
+0.114
0.17%
jan 1, 1988
65.526
-0.015
-0.02%
jan 1, 1989
65.369
-0.157
-0.24%
jan 1, 1990
65.089
-0.28
-0.43%
jan 1, 1991
64.746
-0.343
-0.53%
jan 1, 1992
64.424
-0.322
-0.5%
jan 1, 1993
64.207
-0.217
-0.34%
jan 1, 1994
64.154
-0.053
-0.08%
jan 1, 1995
64.282
+0.128
0.2%
jan 1, 1996
64.576
+0.294
0.46%
jan 1, 1997
64.994
+0.418
0.65%
jan 1, 1998
65.462
+0.468
0.72%
jan 1, 1999
65.923
+0.461
0.7%
jan 1, 2000
66.355
+0.432
0.66%
jan 1, 2001
66.758
+0.403
0.61%
jan 1, 2002
67.15
+0.392
0.59%
jan 1, 2003
67.561
+0.411
0.61%
jan 1, 2004
68.004
+0.443
0.66%
jan 1, 2005
68.47
+0.467
0.69%
jan 1, 2006
68.937
+0.467
0.68%
jan 1, 2007
69.375
+0.438
0.64%
jan 1, 2008
69.757
+0.381
0.55%
jan 1, 2009
70.064
+0.307
0.44%
jan 1, 2010
70.294
+0.23
0.33%
jan 1, 2011
70.451
+0.158
0.22%
jan 1, 2012
70.552
+0.1
0.14%
jan 1, 2013
70.624
+0.072
0.1%
jan 1, 2014
70.691
+0.067
0.09%
jan 1, 2015
70.763
+0.073
0.1%
Ranking of countries by current statistics by years


Comments: