29
/
en
AIzaSyAYiBZKx7MnpbEhh9jyipgxe19OcubqV5w
April 1, 2024
130691
Ethiopia
ETH
true
2
1
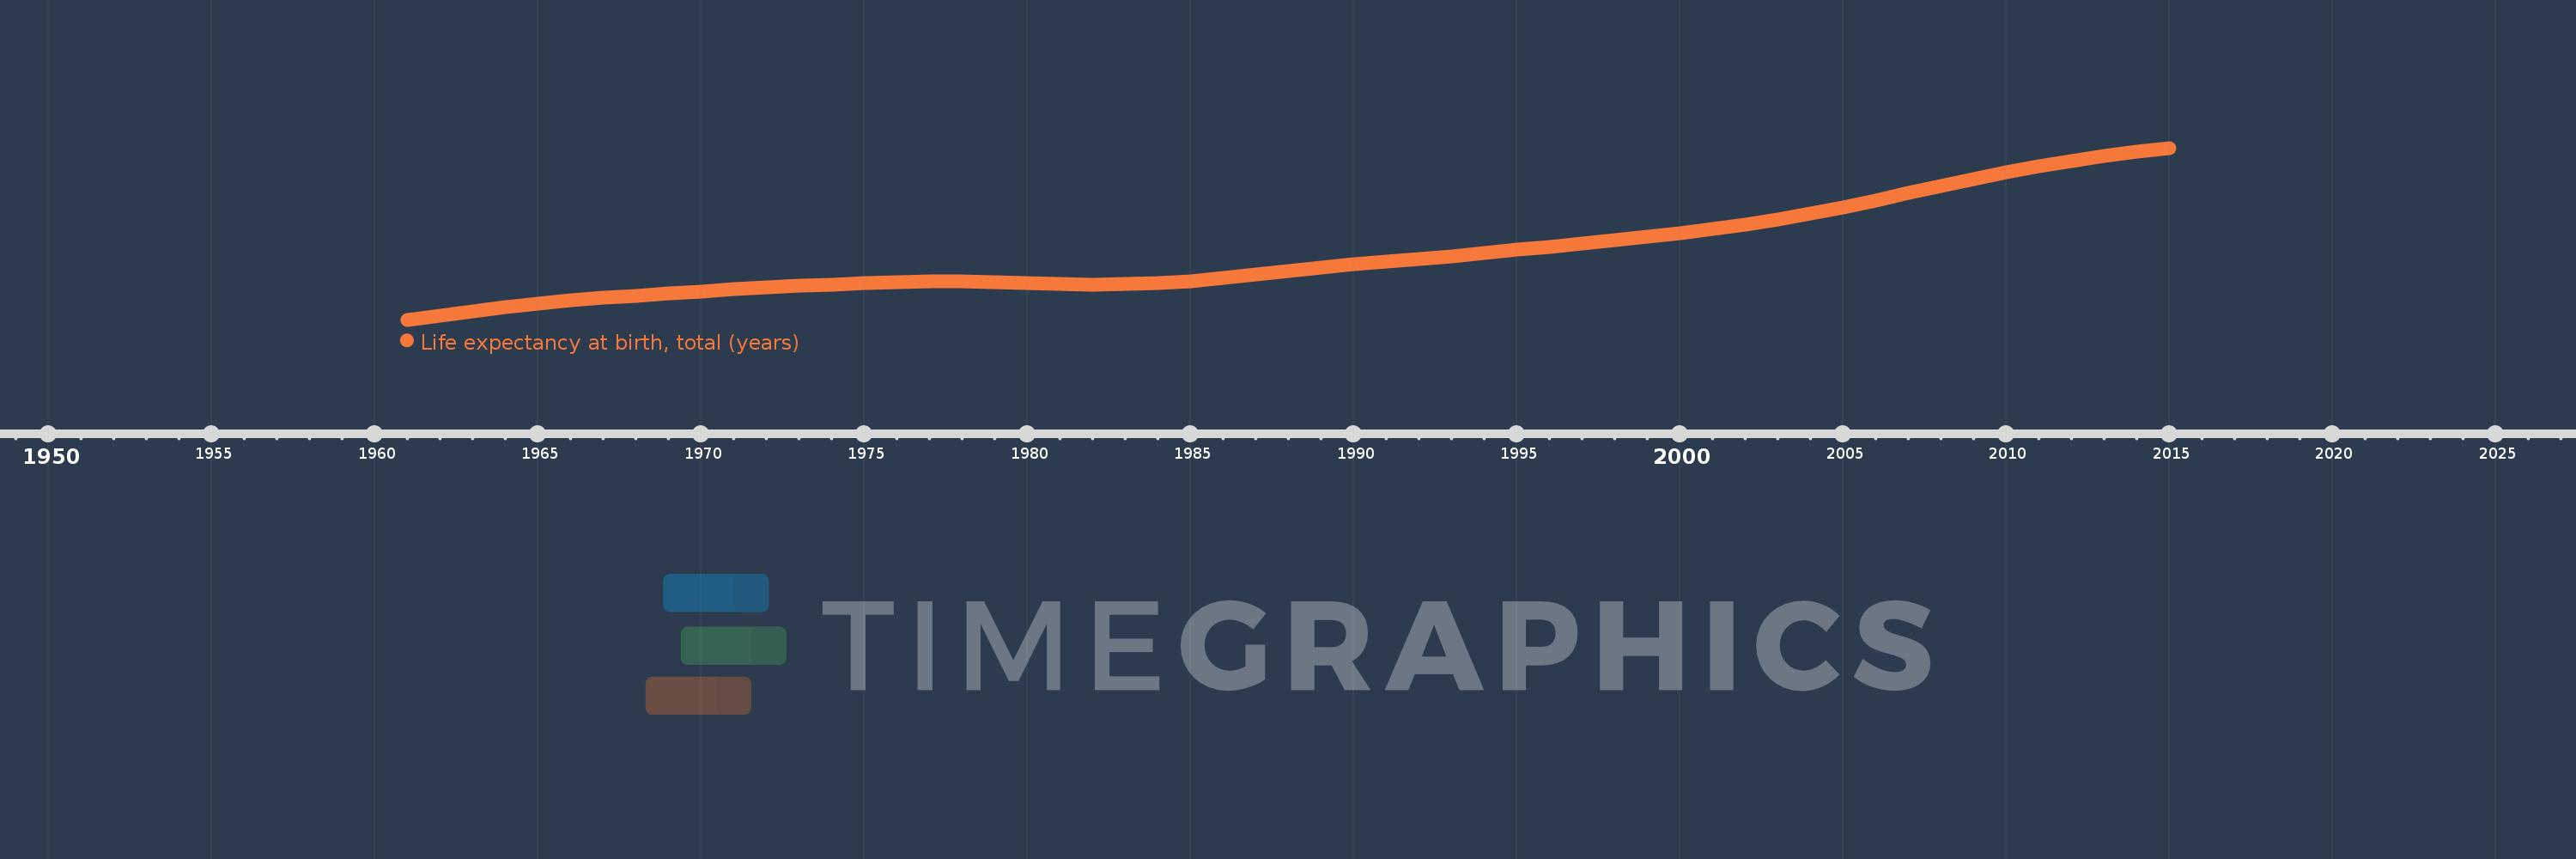
Life expectancy at birth, total (years)
2015,2014,2013,2012,2011,2010,2009,2008,2007,2006,2005,2004,2003,2002,2001,2000,1999,1998,1997,1996,1995,1994,1993,1992,1991,1990,1989,1988,1987,1986,1985,1984,1983,1982,1981,1980,1979,1978,1977,1976,1975,1974,1973,1972,1971,1970,1969,1968,1967,1966,1965,1964,1963,1962,1961
This statistics in other country:
AfghanistanAlbaniaAlgeriaAngolaAntigua and BarbudaArab WorldArgentinaArmeniaArubaAustraliaAustriaAzerbaijanBahamas, TheBahrainBangladeshBarbadosBelarusBelgiumBelizeBeninBermudaBhutanBoliviaBosnia and HerzegovinaBotswanaBrazilBrunei DarussalamBulgariaBurkina FasoBurundiCabo VerdeCambodiaCameroonCanadaCaribbean small statesCentral African RepublicCentral Europe and the BalticsChadChannel IslandsChileChinaColombiaComorosCongo, Dem. Rep.Congo, Rep.Costa RicaCote d'IvoireCroatiaCubaCuracaoCyprusCzech RepublicDenmarkDjiboutiDominicaDominican RepublicEarly-demographic dividendEast Asia & PacificEast Asia & Pacific (excluding high income)East Asia & Pacific (IDA & IBRD countries)EcuadorEgypt, Arab Rep.El SalvadorEquatorial GuineaEritreaEstoniaEthiopiaEuro areaEurope & Central AsiaEurope & Central Asia (excluding high income)Europe & Central Asia (IDA & IBRD countries)European UnionFaroe IslandsFijiFinlandFragile and conflict affected situationsFranceFrench PolynesiaGabonGambia, TheGeorgiaGermanyGhanaGreeceGreenlandGrenadaGuamGuatemalaGuineaGuinea-BissauGuyanaHaitiHeavily indebted poor countries (HIPC)High incomeHondurasHong Kong SAR, ChinaHungaryIBRD onlyIcelandIDA & IBRD totalIDA blendIDA onlyIDA totalIndiaIndonesiaIran, Islamic Rep.IraqIrelandIsle of ManIsraelItalyJamaicaJapanJordanKazakhstanKenyaKiribatiKorea, Dem. People’s Rep.Korea, Rep.KosovoKuwaitKyrgyz RepublicLao PDRLate-demographic dividendLatin America & Caribbean Latin America & Caribbean (excluding high income)Latin America & the Caribbean (IDA & IBRD countries)LatviaLeast developed countries: UN classificationLebanonLesothoLiberiaLibyaLiechtensteinLithuaniaLow & middle incomeLow incomeLower middle incomeLuxembourgMacao SAR, ChinaMacedonia, FYRMadagascarMalawiMalaysiaMaldivesMaliMaltaMarshall IslandsMauritaniaMauritiusMexicoMicronesia, Fed. Sts.Middle East & North AfricaMiddle East & North Africa (excluding high income)Middle East & North Africa (IDA & IBRD countries)Middle incomeMoldovaMongoliaMontenegroMoroccoMozambiqueMyanmarNamibiaNepalNetherlandsNew CaledoniaNew ZealandNicaraguaNigerNigeriaNorth AmericaNorwayOECD membersOmanOther small statesPacific island small statesPakistanPalauPanamaPapua New GuineaParaguayPeruPhilippinesPolandPortugalPost-demographic dividendPre-demographic dividendPuerto RicoQatarRomaniaRussian FederationRwandaSamoaSan MarinoSao Tome and PrincipeSaudi ArabiaSenegalSerbiaSeychellesSierra LeoneSingaporeSint Maarten (Dutch part)Slovak RepublicSloveniaSmall statesSolomon IslandsSomaliaSouth AfricaSouth AsiaSouth Asia (IDA & IBRD)South SudanSpainSri LankaSt. Kitts and NevisSt. LuciaSt. Martin (French part)St. Vincent and the GrenadinesSub-Saharan Africa Sub-Saharan Africa (excluding high income)Sub-Saharan Africa (IDA & IBRD countries)SudanSurinameSwazilandSwedenSwitzerlandSyrian Arab RepublicTajikistanTanzaniaThailandTimor-LesteTogoTongaTrinidad and TobagoTunisiaTurkeyTurkmenistanUgandaUkraineUnited Arab EmiratesUnited KingdomUnited StatesUpper middle incomeUruguayUzbekistanVanuatuVenezuela, RBVietnamVirgin Islands (U.S.)West Bank and GazaWorldYemen, Rep.ZambiaZimbabwe Timeline:
This timeline shows a graph from 1961 to 2015 of Ethiopia. No data until 1960. Number of actual observations by date: 55.
Source name:
World Development Indicators
Source organization:
Derived from male and female life expectancy at birth from sources such as: (1) United Nations Population Division. World Population Prospects, (2) Census reports and other statistical publications from national statistical offices, (3) Eurostat: Demographic Statistics, (4) United Nations Statistical Division. Population and Vital Statistics Reprot (various years), (5) U.S. Census Bureau: International Database, and (6) Secretariat of the Pacific Community: Statistics and Demography Programme.
Categories, topics:
Health
Last updated:
apr 23, 2017
Indicators value changes by year
Minimum:
38.406
jan 1, 1961
Maximum:
64.035
jan 1, 2015
At the date of observation
Value
Absolute change
Change from previous value
jan 1, 1961
38.406
+38.406
0.0%
jan 1, 1962
39.069
+0.663
1.73%
jan 1, 1963
39.699
+0.63
1.61%
jan 1, 1964
40.278
+0.579
1.46%
jan 1, 1965
40.798
+0.52
1.29%
jan 1, 1966
41.256
+0.458
1.12%
jan 1, 1967
41.656
+0.4
0.97%
jan 1, 1968
42.015
+0.359
0.86%
jan 1, 1969
42.343
+0.329
0.78%
jan 1, 1970
42.647
+0.304
0.72%
jan 1, 1971
42.931
+0.284
0.67%
jan 1, 1972
43.2
+0.269
0.63%
jan 1, 1973
43.451
+0.251
0.58%
jan 1, 1974
43.679
+0.229
0.53%
jan 1, 1975
43.88
+0.201
0.46%
jan 1, 1976
44.031
+0.151
0.34%
jan 1, 1977
44.104
+0.073
0.16%
jan 1, 1978
44.092
-0.012
-0.03%
jan 1, 1979
44.007
-0.085
-0.19%
jan 1, 1980
43.873
-0.134
-0.3%
jan 1, 1981
43.74
-0.133
-0.3%
jan 1, 1982
43.67
-0.07
-0.16%
jan 1, 1983
43.708
+0.038
0.09%
jan 1, 1984
43.882
+0.174
0.4%
jan 1, 1985
44.196
+0.314
0.72%
jan 1, 1986
44.63
+0.434
0.98%
jan 1, 1987
45.144
+0.514
1.15%
jan 1, 1988
45.678
+0.535
1.18%
jan 1, 1989
46.192
+0.514
1.12%
jan 1, 1990
46.666
+0.474
1.03%
jan 1, 1991
47.1
+0.433
0.93%
jan 1, 1992
47.505
+0.406
0.86%
jan 1, 1993
47.913
+0.408
0.86%
jan 1, 1994
48.348
+0.434
0.91%
jan 1, 1995
48.813
+0.466
0.96%
jan 1, 1996
49.306
+0.492
1.01%
jan 1, 1997
49.81
+0.504
1.02%
jan 1, 1998
50.318
+0.508
1.02%
jan 1, 1999
50.83
+0.512
1.02%
jan 1, 2000
51.358
+0.527
1.04%
jan 1, 2001
51.93
+0.573
1.12%
jan 1, 2002
52.587
+0.657
1.26%
jan 1, 2003
53.348
+0.761
1.45%
jan 1, 2004
54.219
+0.871
1.63%
jan 1, 2005
55.19
+0.971
1.79%
jan 1, 2006
56.237
+1.047
1.9%
jan 1, 2007
57.325
+1.088
1.94%
jan 1, 2008
58.408
+1.083
1.89%
jan 1, 2009
59.447
+1.039
1.78%
jan 1, 2010
60.416
+0.969
1.63%
jan 1, 2011
61.296
+0.88
1.46%
jan 1, 2012
62.083
+0.787
1.28%
jan 1, 2013
62.794
+0.711
1.14%
jan 1, 2014
63.442
+0.649
1.03%
jan 1, 2015
64.035
+0.593
0.93%
Ranking of countries by current statistics by years


Comments: