29
/
en
AIzaSyAYiBZKx7MnpbEhh9jyipgxe19OcubqV5w
April 1, 2024
76363
Bahamas, The
BHS
true
2
1
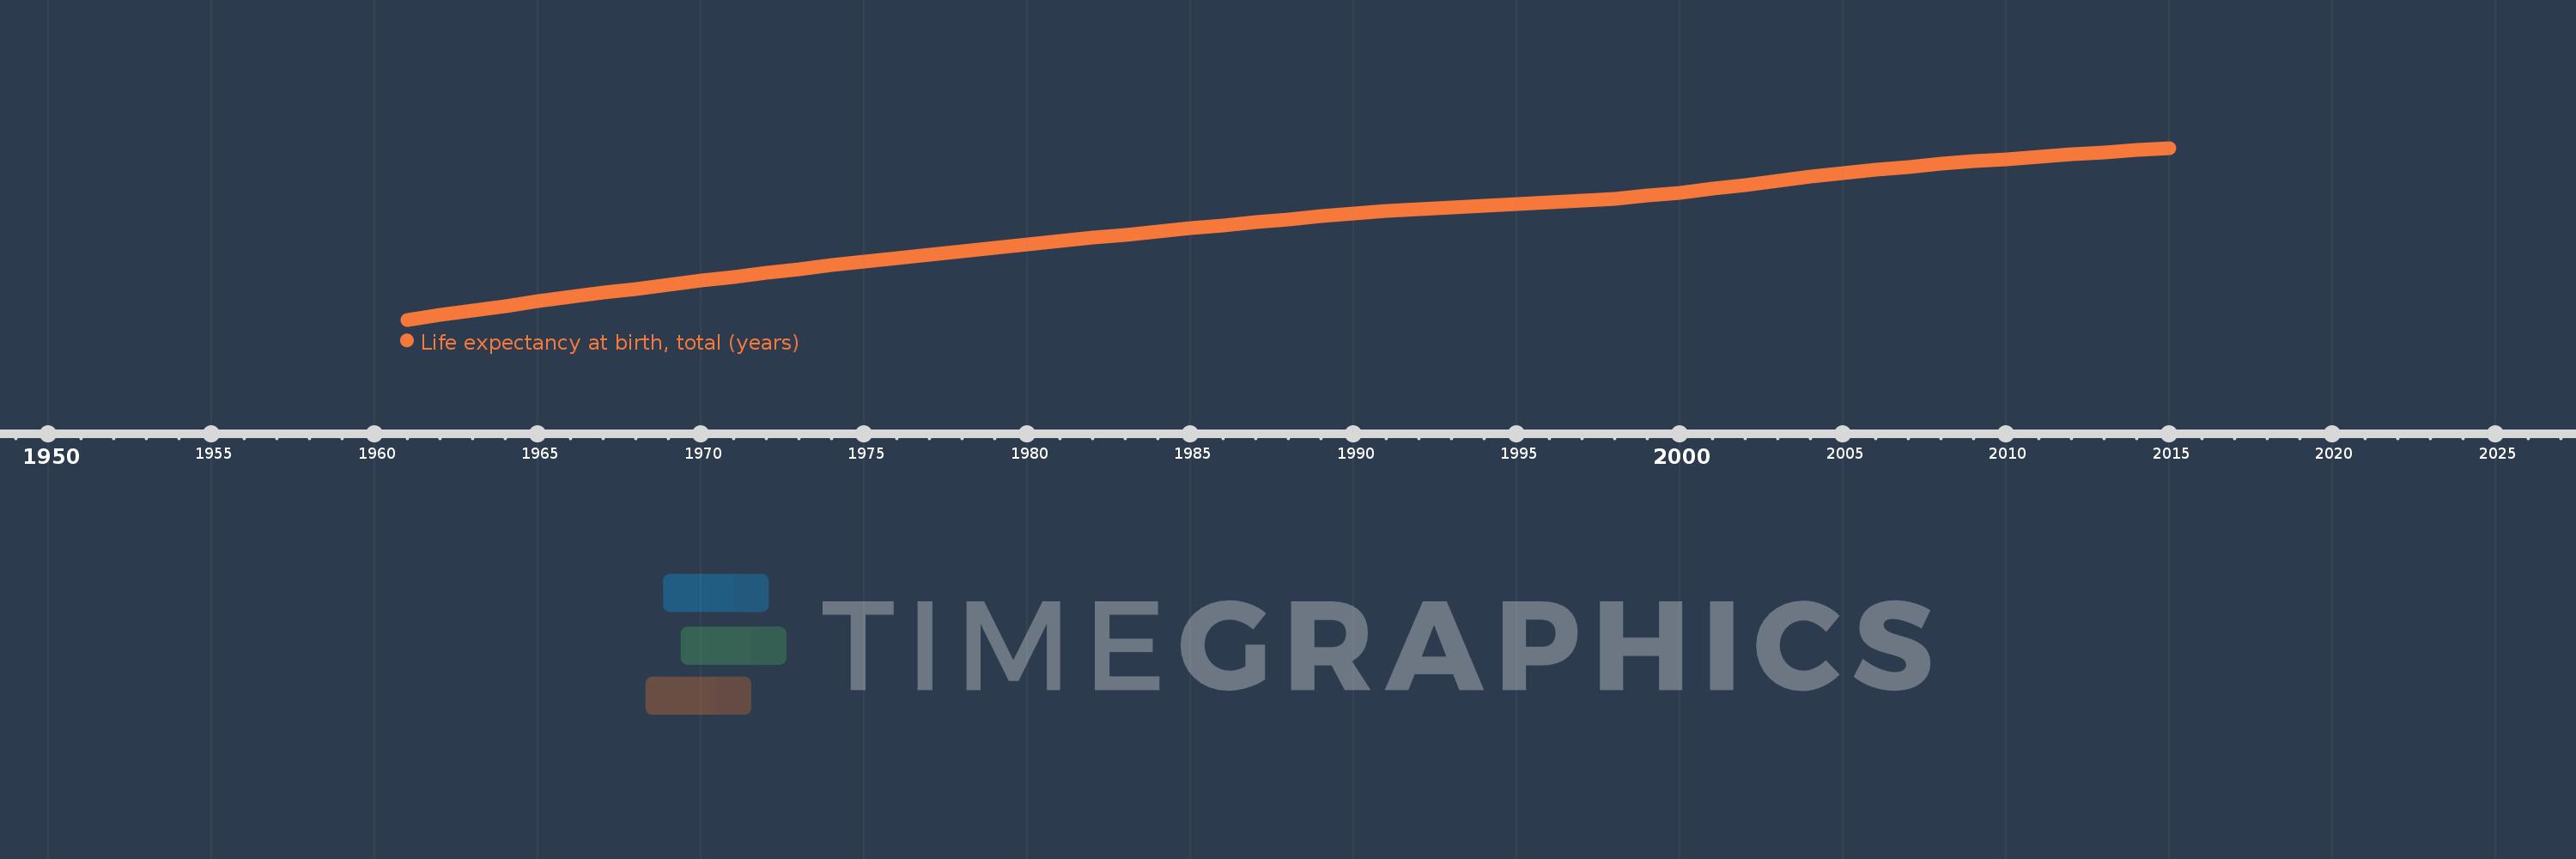
Life expectancy at birth, total (years)
2015,2014,2013,2012,2011,2010,2009,2008,2007,2006,2005,2004,2003,2002,2001,2000,1999,1998,1997,1996,1995,1994,1993,1992,1991,1990,1989,1988,1987,1986,1985,1984,1983,1982,1981,1980,1979,1978,1977,1976,1975,1974,1973,1972,1971,1970,1969,1968,1967,1966,1965,1964,1963,1962,1961
This statistics in other country:
AfghanistanAlbaniaAlgeriaAngolaAntigua and BarbudaArab WorldArgentinaArmeniaArubaAustraliaAustriaAzerbaijanBahamas, TheBahrainBangladeshBarbadosBelarusBelgiumBelizeBeninBermudaBhutanBoliviaBosnia and HerzegovinaBotswanaBrazilBrunei DarussalamBulgariaBurkina FasoBurundiCabo VerdeCambodiaCameroonCanadaCaribbean small statesCentral African RepublicCentral Europe and the BalticsChadChannel IslandsChileChinaColombiaComorosCongo, Dem. Rep.Congo, Rep.Costa RicaCote d'IvoireCroatiaCubaCuracaoCyprusCzech RepublicDenmarkDjiboutiDominicaDominican RepublicEarly-demographic dividendEast Asia & PacificEast Asia & Pacific (excluding high income)East Asia & Pacific (IDA & IBRD countries)EcuadorEgypt, Arab Rep.El SalvadorEquatorial GuineaEritreaEstoniaEthiopiaEuro areaEurope & Central AsiaEurope & Central Asia (excluding high income)Europe & Central Asia (IDA & IBRD countries)European UnionFaroe IslandsFijiFinlandFragile and conflict affected situationsFranceFrench PolynesiaGabonGambia, TheGeorgiaGermanyGhanaGreeceGreenlandGrenadaGuamGuatemalaGuineaGuinea-BissauGuyanaHaitiHeavily indebted poor countries (HIPC)High incomeHondurasHong Kong SAR, ChinaHungaryIBRD onlyIcelandIDA & IBRD totalIDA blendIDA onlyIDA totalIndiaIndonesiaIran, Islamic Rep.IraqIrelandIsle of ManIsraelItalyJamaicaJapanJordanKazakhstanKenyaKiribatiKorea, Dem. People’s Rep.Korea, Rep.KosovoKuwaitKyrgyz RepublicLao PDRLate-demographic dividendLatin America & Caribbean Latin America & Caribbean (excluding high income)Latin America & the Caribbean (IDA & IBRD countries)LatviaLeast developed countries: UN classificationLebanonLesothoLiberiaLibyaLiechtensteinLithuaniaLow & middle incomeLow incomeLower middle incomeLuxembourgMacao SAR, ChinaMacedonia, FYRMadagascarMalawiMalaysiaMaldivesMaliMaltaMarshall IslandsMauritaniaMauritiusMexicoMicronesia, Fed. Sts.Middle East & North AfricaMiddle East & North Africa (excluding high income)Middle East & North Africa (IDA & IBRD countries)Middle incomeMoldovaMongoliaMontenegroMoroccoMozambiqueMyanmarNamibiaNepalNetherlandsNew CaledoniaNew ZealandNicaraguaNigerNigeriaNorth AmericaNorwayOECD membersOmanOther small statesPacific island small statesPakistanPalauPanamaPapua New GuineaParaguayPeruPhilippinesPolandPortugalPost-demographic dividendPre-demographic dividendPuerto RicoQatarRomaniaRussian FederationRwandaSamoaSan MarinoSao Tome and PrincipeSaudi ArabiaSenegalSerbiaSeychellesSierra LeoneSingaporeSint Maarten (Dutch part)Slovak RepublicSloveniaSmall statesSolomon IslandsSomaliaSouth AfricaSouth AsiaSouth Asia (IDA & IBRD)South SudanSpainSri LankaSt. Kitts and NevisSt. LuciaSt. Martin (French part)St. Vincent and the GrenadinesSub-Saharan Africa Sub-Saharan Africa (excluding high income)Sub-Saharan Africa (IDA & IBRD countries)SudanSurinameSwazilandSwedenSwitzerlandSyrian Arab RepublicTajikistanTanzaniaThailandTimor-LesteTogoTongaTrinidad and TobagoTunisiaTurkeyTurkmenistanUgandaUkraineUnited Arab EmiratesUnited KingdomUnited StatesUpper middle incomeUruguayUzbekistanVanuatuVenezuela, RBVietnamVirgin Islands (U.S.)West Bank and GazaWorldYemen, Rep.ZambiaZimbabwe Timeline:
This timeline shows a graph from 1961 to 2015 of Bahamas, The. No data until 1960. Number of actual observations by date: 55.
Source name:
World Development Indicators
Source organization:
Derived from male and female life expectancy at birth from sources such as: (1) United Nations Population Division. World Population Prospects, (2) Census reports and other statistical publications from national statistical offices, (3) Eurostat: Demographic Statistics, (4) United Nations Statistical Division. Population and Vital Statistics Reprot (various years), (5) U.S. Census Bureau: International Database, and (6) Secretariat of the Pacific Community: Statistics and Demography Programme.
Categories, topics:
Health
Last updated:
apr 23, 2017
Indicators value changes by year
Minimum:
62.729
jan 1, 1961
Maximum:
75.234
jan 1, 2015
At the date of observation
Value
Absolute change
Change from previous value
jan 1, 1961
62.729
+62.729
0.0%
jan 1, 1962
63.073
+0.343
0.55%
jan 1, 1963
63.408
+0.336
0.53%
jan 1, 1964
63.737
+0.329
0.52%
jan 1, 1965
64.059
+0.322
0.51%
jan 1, 1966
64.375
+0.316
0.49%
jan 1, 1967
64.684
+0.309
0.48%
jan 1, 1968
64.987
+0.304
0.47%
jan 1, 1969
65.285
+0.298
0.46%
jan 1, 1970
65.577
+0.292
0.45%
jan 1, 1971
65.864
+0.287
0.44%
jan 1, 1972
66.146
+0.282
0.43%
jan 1, 1973
66.422
+0.277
0.42%
jan 1, 1974
66.693
+0.271
0.41%
jan 1, 1975
66.959
+0.266
0.4%
jan 1, 1976
67.22
+0.261
0.39%
jan 1, 1977
67.476
+0.256
0.38%
jan 1, 1978
67.728
+0.252
0.37%
jan 1, 1979
67.975
+0.247
0.36%
jan 1, 1980
68.219
+0.244
0.36%
jan 1, 1981
68.459
+0.24
0.35%
jan 1, 1982
68.695
+0.237
0.35%
jan 1, 1983
68.93
+0.234
0.34%
jan 1, 1984
69.16
+0.231
0.33%
jan 1, 1985
69.387
+0.227
0.33%
jan 1, 1986
69.611
+0.223
0.32%
jan 1, 1987
69.829
+0.218
0.31%
jan 1, 1988
70.043
+0.214
0.31%
jan 1, 1989
70.25
+0.207
0.3%
jan 1, 1990
70.448
+0.198
0.28%
jan 1, 1991
70.631
+0.183
0.26%
jan 1, 1992
70.792
+0.161
0.23%
jan 1, 1993
70.93
+0.138
0.19%
jan 1, 1994
71.048
+0.119
0.17%
jan 1, 1995
71.155
+0.107
0.15%
jan 1, 1996
71.263
+0.108
0.15%
jan 1, 1997
71.39
+0.128
0.18%
jan 1, 1998
71.55
+0.159
0.22%
jan 1, 1999
71.748
+0.198
0.28%
jan 1, 2000
71.984
+0.236
0.33%
jan 1, 2001
72.254
+0.27
0.37%
jan 1, 2002
72.545
+0.291
0.4%
jan 1, 2003
72.841
+0.296
0.41%
jan 1, 2004
73.127
+0.286
0.39%
jan 1, 2005
73.395
+0.267
0.37%
jan 1, 2006
73.639
+0.244
0.33%
jan 1, 2007
73.858
+0.22
0.3%
jan 1, 2008
74.059
+0.201
0.27%
jan 1, 2009
74.247
+0.188
0.25%
jan 1, 2010
74.424
+0.176
0.24%
jan 1, 2011
74.592
+0.168
0.23%
jan 1, 2012
74.754
+0.162
0.22%
jan 1, 2013
74.914
+0.16
0.21%
jan 1, 2014
75.074
+0.159
0.21%
jan 1, 2015
75.234
+0.16
0.21%
Ranking of countries by current statistics by years


Comments: