29
/
en
AIzaSyAYiBZKx7MnpbEhh9jyipgxe19OcubqV5w
April 1, 2024
39153
IDA only
IDX
false
2
1
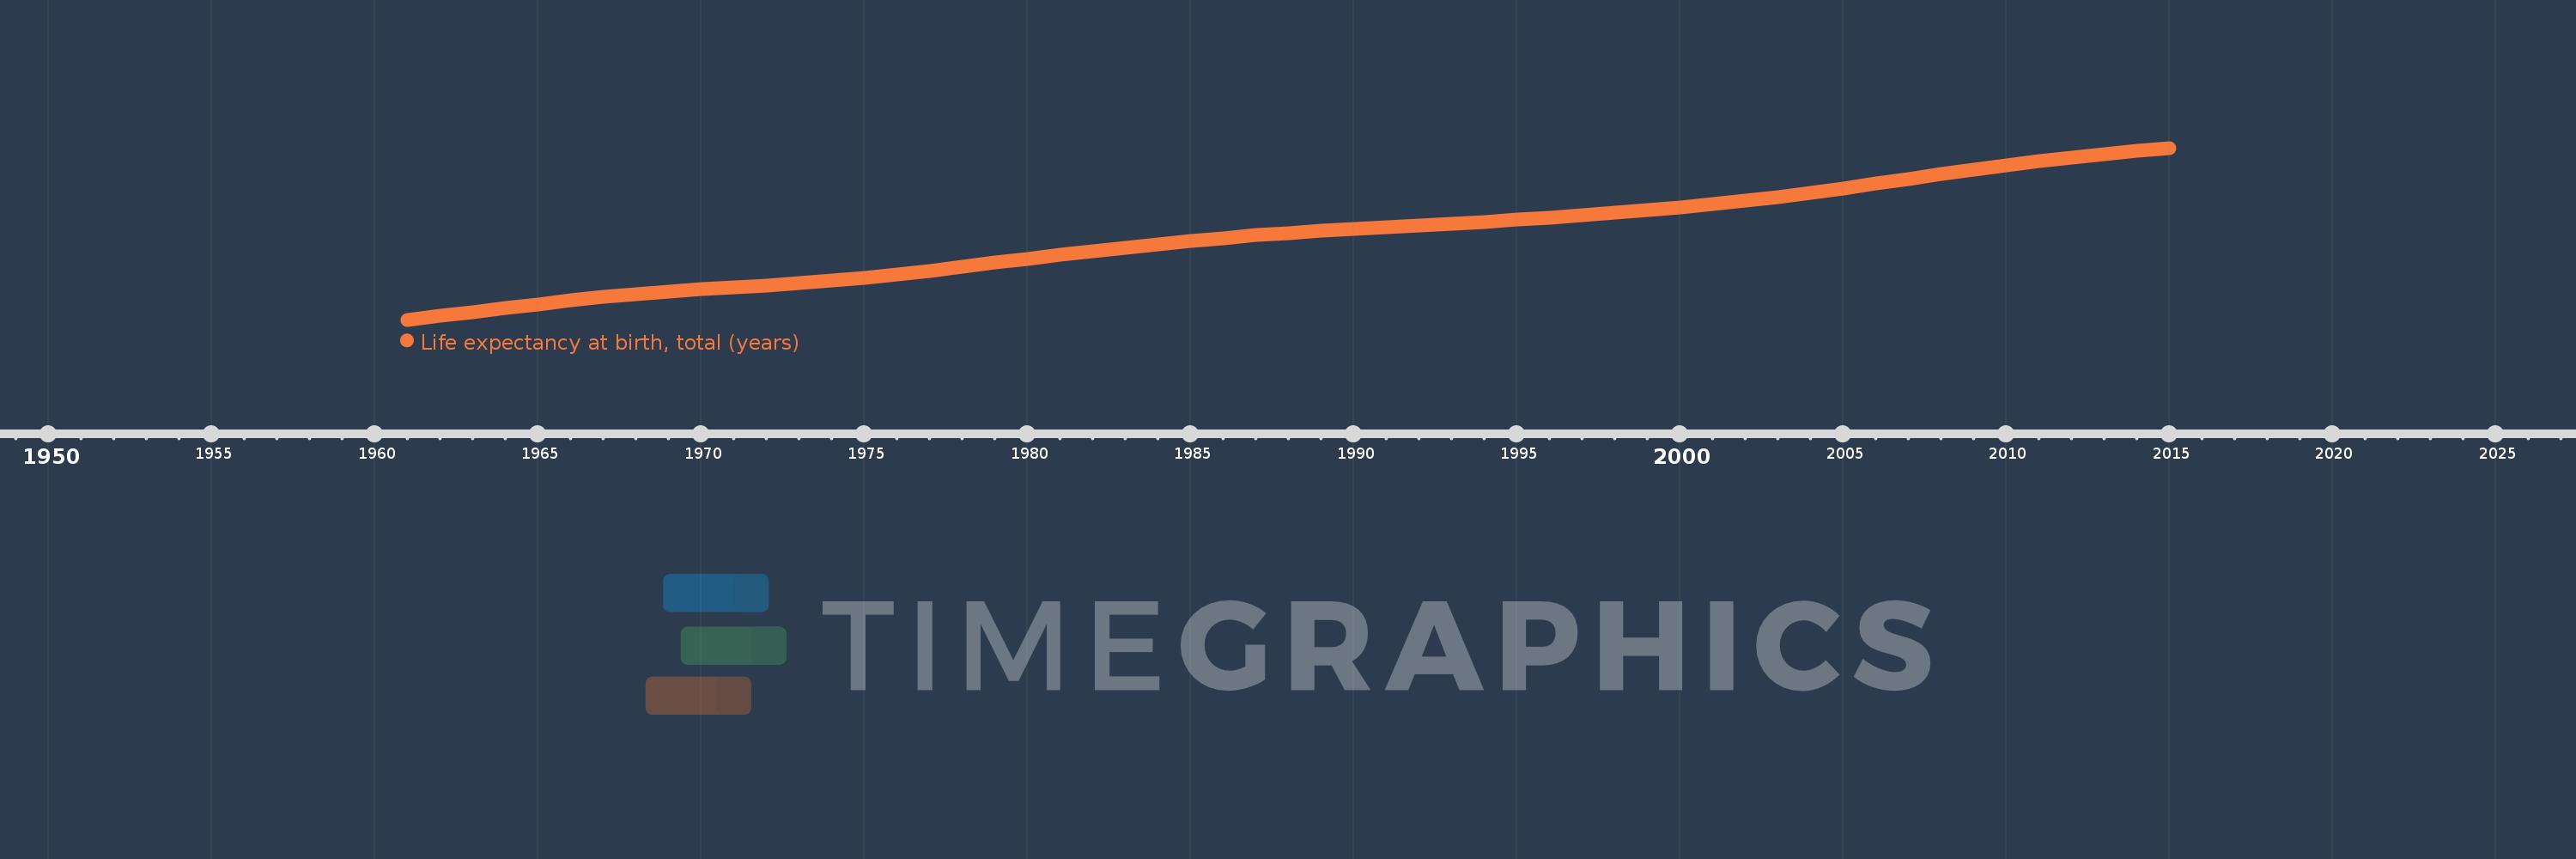
Life expectancy at birth, total (years)
2015,2014,2013,2012,2011,2010,2009,2008,2007,2006,2005,2004,2003,2002,2001,2000,1999,1998,1997,1996,1995,1994,1993,1992,1991,1990,1989,1988,1987,1986,1985,1984,1983,1982,1981,1980,1979,1978,1977,1976,1975,1974,1973,1972,1971,1970,1969,1968,1967,1966,1965,1964,1963,1962,1961
This statistics in other country:
AfghanistanAlbaniaAlgeriaAngolaAntigua and BarbudaArab WorldArgentinaArmeniaArubaAustraliaAustriaAzerbaijanBahamas, TheBahrainBangladeshBarbadosBelarusBelgiumBelizeBeninBermudaBhutanBoliviaBosnia and HerzegovinaBotswanaBrazilBrunei DarussalamBulgariaBurkina FasoBurundiCabo VerdeCambodiaCameroonCanadaCaribbean small statesCentral African RepublicCentral Europe and the BalticsChadChannel IslandsChileChinaColombiaComorosCongo, Dem. Rep.Congo, Rep.Costa RicaCote d'IvoireCroatiaCubaCuracaoCyprusCzech RepublicDenmarkDjiboutiDominicaDominican RepublicEarly-demographic dividendEast Asia & PacificEast Asia & Pacific (excluding high income)East Asia & Pacific (IDA & IBRD countries)EcuadorEgypt, Arab Rep.El SalvadorEquatorial GuineaEritreaEstoniaEthiopiaEuro areaEurope & Central AsiaEurope & Central Asia (excluding high income)Europe & Central Asia (IDA & IBRD countries)European UnionFaroe IslandsFijiFinlandFragile and conflict affected situationsFranceFrench PolynesiaGabonGambia, TheGeorgiaGermanyGhanaGreeceGreenlandGrenadaGuamGuatemalaGuineaGuinea-BissauGuyanaHaitiHeavily indebted poor countries (HIPC)High incomeHondurasHong Kong SAR, ChinaHungaryIBRD onlyIcelandIDA & IBRD totalIDA blendIDA onlyIDA totalIndiaIndonesiaIran, Islamic Rep.IraqIrelandIsle of ManIsraelItalyJamaicaJapanJordanKazakhstanKenyaKiribatiKorea, Dem. People’s Rep.Korea, Rep.KosovoKuwaitKyrgyz RepublicLao PDRLate-demographic dividendLatin America & Caribbean Latin America & Caribbean (excluding high income)Latin America & the Caribbean (IDA & IBRD countries)LatviaLeast developed countries: UN classificationLebanonLesothoLiberiaLibyaLiechtensteinLithuaniaLow & middle incomeLow incomeLower middle incomeLuxembourgMacao SAR, ChinaMacedonia, FYRMadagascarMalawiMalaysiaMaldivesMaliMaltaMarshall IslandsMauritaniaMauritiusMexicoMicronesia, Fed. Sts.Middle East & North AfricaMiddle East & North Africa (excluding high income)Middle East & North Africa (IDA & IBRD countries)Middle incomeMoldovaMongoliaMontenegroMoroccoMozambiqueMyanmarNamibiaNepalNetherlandsNew CaledoniaNew ZealandNicaraguaNigerNigeriaNorth AmericaNorwayOECD membersOmanOther small statesPacific island small statesPakistanPalauPanamaPapua New GuineaParaguayPeruPhilippinesPolandPortugalPost-demographic dividendPre-demographic dividendPuerto RicoQatarRomaniaRussian FederationRwandaSamoaSan MarinoSao Tome and PrincipeSaudi ArabiaSenegalSerbiaSeychellesSierra LeoneSingaporeSint Maarten (Dutch part)Slovak RepublicSloveniaSmall statesSolomon IslandsSomaliaSouth AfricaSouth AsiaSouth Asia (IDA & IBRD)South SudanSpainSri LankaSt. Kitts and NevisSt. LuciaSt. Martin (French part)St. Vincent and the GrenadinesSub-Saharan Africa Sub-Saharan Africa (excluding high income)Sub-Saharan Africa (IDA & IBRD countries)SudanSurinameSwazilandSwedenSwitzerlandSyrian Arab RepublicTajikistanTanzaniaThailandTimor-LesteTogoTongaTrinidad and TobagoTunisiaTurkeyTurkmenistanUgandaUkraineUnited Arab EmiratesUnited KingdomUnited StatesUpper middle incomeUruguayUzbekistanVanuatuVenezuela, RBVietnamVirgin Islands (U.S.)West Bank and GazaWorldYemen, Rep.ZambiaZimbabwe Timeline:
This timeline shows a graph from 1961 to 2015 of IDA only. No data until 1960. Number of actual observations by date: 55.
Source name:
World Development Indicators
Source organization:
Derived from male and female life expectancy at birth from sources such as: (1) United Nations Population Division. World Population Prospects, (2) Census reports and other statistical publications from national statistical offices, (3) Eurostat: Demographic Statistics, (4) United Nations Statistical Division. Population and Vital Statistics Reprot (various years), (5) U.S. Census Bureau: International Database, and (6) Secretariat of the Pacific Community: Statistics and Demography Programme.
Categories, topics:
Health
Last updated:
apr 23, 2017
Indicators value changes by year
Minimum:
41.287
jan 1, 1961
Maximum:
63.459
jan 1, 2015
At the date of observation
Value
Absolute change
Change from previous value
jan 1, 1961
41.287
+41.287
0.0%
jan 1, 1962
41.78
+0.492
1.19%
jan 1, 1963
42.279
+0.5
1.2%
jan 1, 1964
42.785
+0.505
1.2%
jan 1, 1965
43.289
+0.505
1.18%
jan 1, 1966
43.776
+0.486
1.12%
jan 1, 1967
44.221
+0.446
1.02%
jan 1, 1968
44.613
+0.392
0.89%
jan 1, 1969
44.947
+0.334
0.75%
jan 1, 1970
45.228
+0.281
0.63%
jan 1, 1971
45.476
+0.248
0.55%
jan 1, 1972
45.72
+0.244
0.54%
jan 1, 1973
45.989
+0.269
0.59%
jan 1, 1974
46.303
+0.314
0.68%
jan 1, 1975
46.673
+0.37
0.8%
jan 1, 1976
47.104
+0.431
0.92%
jan 1, 1977
47.592
+0.488
1.04%
jan 1, 1978
48.115
+0.523
1.1%
jan 1, 1979
48.646
+0.531
1.1%
jan 1, 1980
49.164
+0.518
1.07%
jan 1, 1981
49.656
+0.492
1.0%
jan 1, 1982
50.173
+0.518
1.04%
jan 1, 1983
50.617
+0.444
0.88%
jan 1, 1984
51.045
+0.428
0.85%
jan 1, 1985
51.455
+0.41
0.8%
jan 1, 1986
51.838
+0.383
0.74%
jan 1, 1987
52.182
+0.345
0.66%
jan 1, 1988
52.487
+0.305
0.58%
jan 1, 1989
52.749
+0.262
0.5%
jan 1, 1990
52.996
+0.248
0.47%
jan 1, 1991
53.218
+0.221
0.42%
jan 1, 1992
53.443
+0.225
0.42%
jan 1, 1993
53.68
+0.237
0.44%
jan 1, 1994
53.933
+0.253
0.47%
jan 1, 1995
54.2
+0.268
0.5%
jan 1, 1996
54.488
+0.288
0.53%
jan 1, 1997
54.797
+0.309
0.57%
jan 1, 1998
55.12
+0.323
0.59%
jan 1, 1999
55.46
+0.34
0.62%
jan 1, 2000
55.829
+0.369
0.67%
jan 1, 2001
56.229
+0.4
0.72%
jan 1, 2002
56.673
+0.444
0.79%
jan 1, 2003
57.159
+0.487
0.86%
jan 1, 2004
57.696
+0.537
0.94%
jan 1, 2005
58.27
+0.574
0.99%
jan 1, 2006
58.869
+0.599
1.03%
jan 1, 2007
59.481
+0.611
1.04%
jan 1, 2008
60.089
+0.609
1.02%
jan 1, 2009
60.678
+0.588
0.98%
jan 1, 2010
61.232
+0.555
0.91%
jan 1, 2011
61.744
+0.511
0.83%
jan 1, 2012
62.214
+0.47
0.76%
jan 1, 2013
62.653
+0.439
0.71%
jan 1, 2014
63.067
+0.414
0.66%
jan 1, 2015
63.459
+0.392
0.62%
Ranking of countries by current statistics by years


Comments: