29
/
en
AIzaSyAYiBZKx7MnpbEhh9jyipgxe19OcubqV5w
April 1, 2024
119115
Denmark
DNK
true
2
1
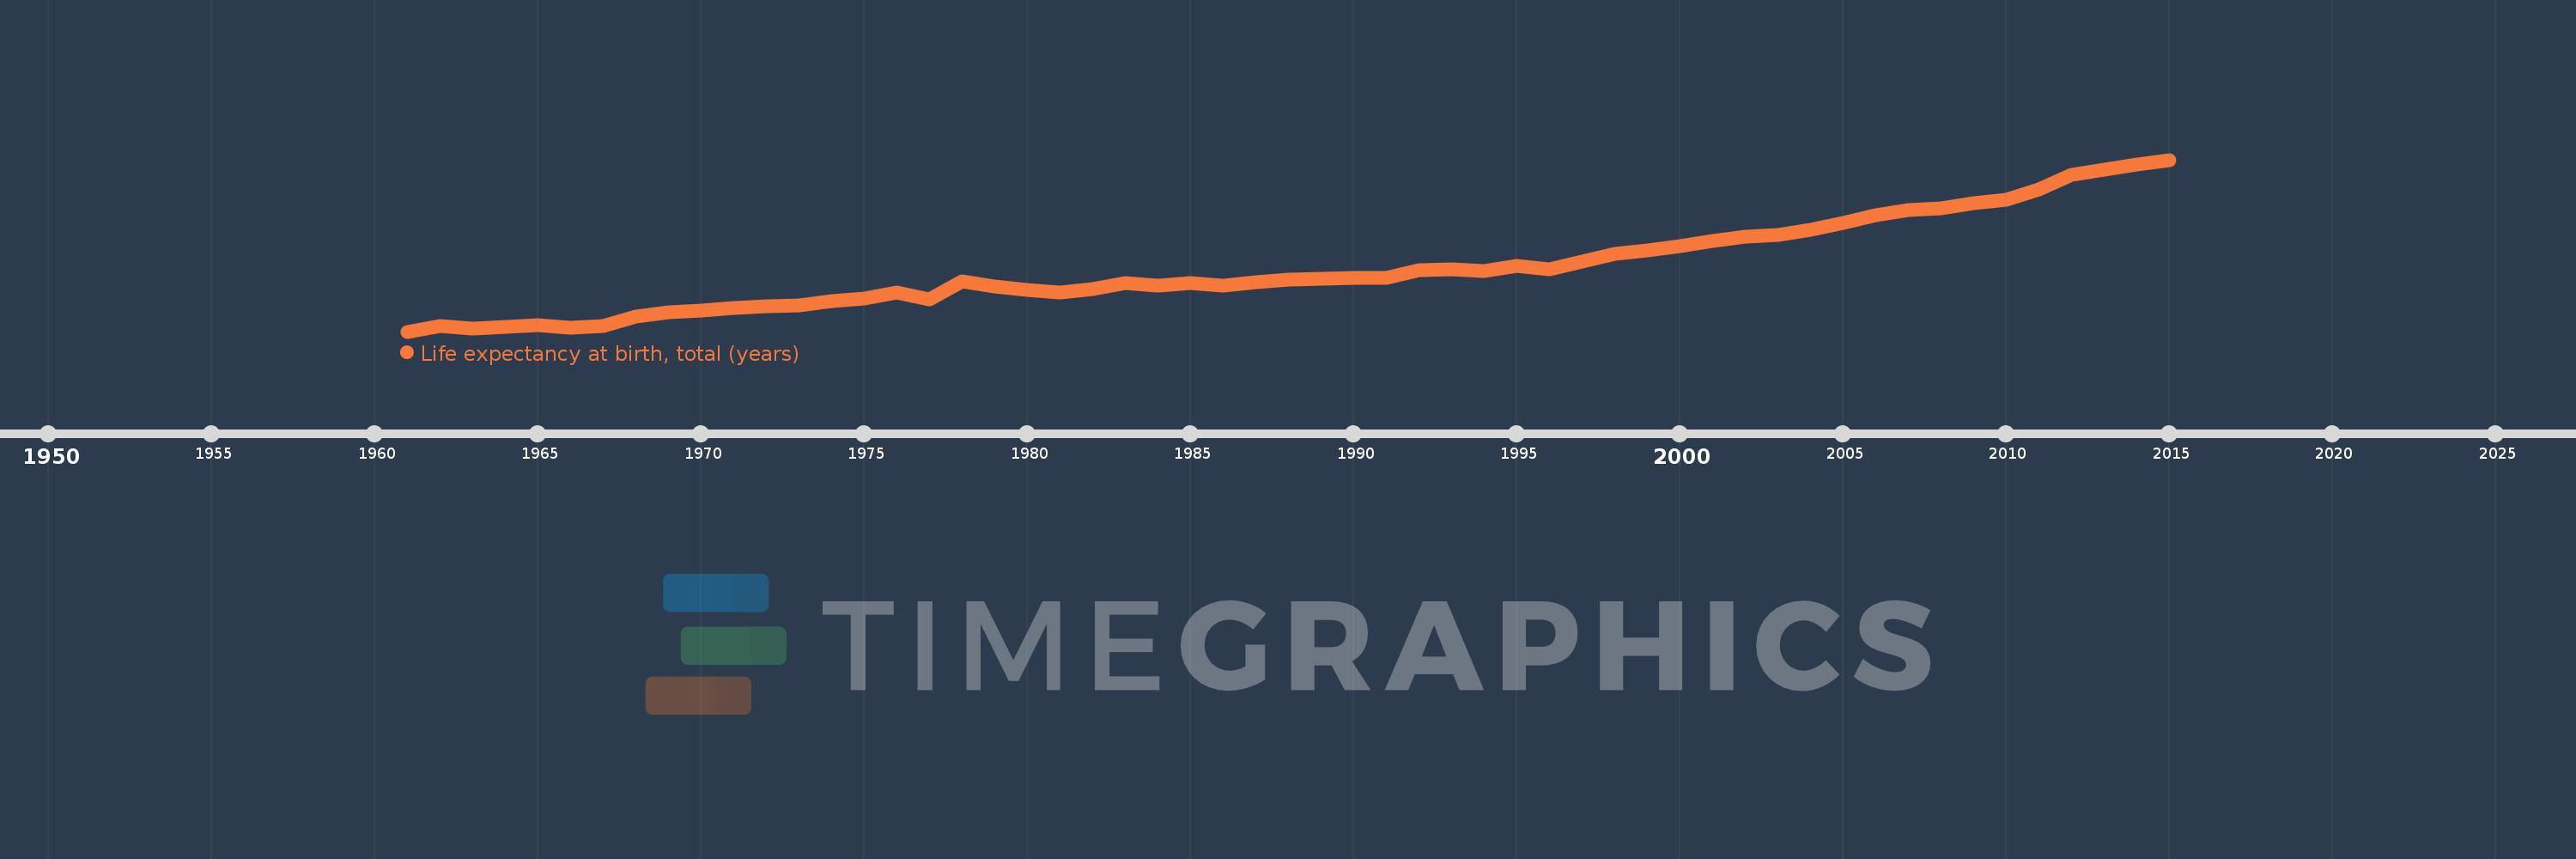
Life expectancy at birth, total (years)
2015,2014,2013,2012,2011,2010,2009,2008,2007,2006,2005,2004,2003,2002,2001,2000,1999,1998,1997,1996,1995,1994,1993,1992,1991,1990,1989,1988,1987,1986,1985,1984,1983,1982,1981,1980,1979,1978,1977,1976,1975,1974,1973,1972,1971,1970,1969,1968,1967,1966,1965,1964,1963,1962,1961
This statistics in other country:
AfghanistanAlbaniaAlgeriaAngolaAntigua and BarbudaArab WorldArgentinaArmeniaArubaAustraliaAustriaAzerbaijanBahamas, TheBahrainBangladeshBarbadosBelarusBelgiumBelizeBeninBermudaBhutanBoliviaBosnia and HerzegovinaBotswanaBrazilBrunei DarussalamBulgariaBurkina FasoBurundiCabo VerdeCambodiaCameroonCanadaCaribbean small statesCentral African RepublicCentral Europe and the BalticsChadChannel IslandsChileChinaColombiaComorosCongo, Dem. Rep.Congo, Rep.Costa RicaCote d'IvoireCroatiaCubaCuracaoCyprusCzech RepublicDenmarkDjiboutiDominicaDominican RepublicEarly-demographic dividendEast Asia & PacificEast Asia & Pacific (excluding high income)East Asia & Pacific (IDA & IBRD countries)EcuadorEgypt, Arab Rep.El SalvadorEquatorial GuineaEritreaEstoniaEthiopiaEuro areaEurope & Central AsiaEurope & Central Asia (excluding high income)Europe & Central Asia (IDA & IBRD countries)European UnionFaroe IslandsFijiFinlandFragile and conflict affected situationsFranceFrench PolynesiaGabonGambia, TheGeorgiaGermanyGhanaGreeceGreenlandGrenadaGuamGuatemalaGuineaGuinea-BissauGuyanaHaitiHeavily indebted poor countries (HIPC)High incomeHondurasHong Kong SAR, ChinaHungaryIBRD onlyIcelandIDA & IBRD totalIDA blendIDA onlyIDA totalIndiaIndonesiaIran, Islamic Rep.IraqIrelandIsle of ManIsraelItalyJamaicaJapanJordanKazakhstanKenyaKiribatiKorea, Dem. People’s Rep.Korea, Rep.KosovoKuwaitKyrgyz RepublicLao PDRLate-demographic dividendLatin America & Caribbean Latin America & Caribbean (excluding high income)Latin America & the Caribbean (IDA & IBRD countries)LatviaLeast developed countries: UN classificationLebanonLesothoLiberiaLibyaLiechtensteinLithuaniaLow & middle incomeLow incomeLower middle incomeLuxembourgMacao SAR, ChinaMacedonia, FYRMadagascarMalawiMalaysiaMaldivesMaliMaltaMarshall IslandsMauritaniaMauritiusMexicoMicronesia, Fed. Sts.Middle East & North AfricaMiddle East & North Africa (excluding high income)Middle East & North Africa (IDA & IBRD countries)Middle incomeMoldovaMongoliaMontenegroMoroccoMozambiqueMyanmarNamibiaNepalNetherlandsNew CaledoniaNew ZealandNicaraguaNigerNigeriaNorth AmericaNorwayOECD membersOmanOther small statesPacific island small statesPakistanPalauPanamaPapua New GuineaParaguayPeruPhilippinesPolandPortugalPost-demographic dividendPre-demographic dividendPuerto RicoQatarRomaniaRussian FederationRwandaSamoaSan MarinoSao Tome and PrincipeSaudi ArabiaSenegalSerbiaSeychellesSierra LeoneSingaporeSint Maarten (Dutch part)Slovak RepublicSloveniaSmall statesSolomon IslandsSomaliaSouth AfricaSouth AsiaSouth Asia (IDA & IBRD)South SudanSpainSri LankaSt. Kitts and NevisSt. LuciaSt. Martin (French part)St. Vincent and the GrenadinesSub-Saharan Africa Sub-Saharan Africa (excluding high income)Sub-Saharan Africa (IDA & IBRD countries)SudanSurinameSwazilandSwedenSwitzerlandSyrian Arab RepublicTajikistanTanzaniaThailandTimor-LesteTogoTongaTrinidad and TobagoTunisiaTurkeyTurkmenistanUgandaUkraineUnited Arab EmiratesUnited KingdomUnited StatesUpper middle incomeUruguayUzbekistanVanuatuVenezuela, RBVietnamVirgin Islands (U.S.)West Bank and GazaWorldYemen, Rep.ZambiaZimbabwe Timeline:
This timeline shows a graph from 1961 to 2015 of Denmark. No data until 1960. Number of actual observations by date: 55.
Source name:
World Development Indicators
Source organization:
Derived from male and female life expectancy at birth from sources such as: (1) United Nations Population Division. World Population Prospects, (2) Census reports and other statistical publications from national statistical offices, (3) Eurostat: Demographic Statistics, (4) United Nations Statistical Division. Population and Vital Statistics Reprot (various years), (5) U.S. Census Bureau: International Database, and (6) Secretariat of the Pacific Community: Statistics and Demography Programme.
Categories, topics:
Health
Last updated:
apr 23, 2017
Indicators value changes by year
Minimum:
72.177
jan 1, 1961
Maximum:
80.549
jan 1, 2015
At the date of observation
Value
Absolute change
Change from previous value
jan 1, 1961
72.177
+72.177
0.0%
jan 1, 1962
72.438
+0.262
0.36%
jan 1, 1963
72.32
-0.119
-0.16%
jan 1, 1964
72.4
+0.081
0.11%
jan 1, 1965
72.485
+0.085
0.12%
jan 1, 1966
72.371
-0.114
-0.16%
jan 1, 1967
72.444
+0.073
0.1%
jan 1, 1968
72.922
+0.478
0.66%
jan 1, 1969
73.121
+0.199
0.27%
jan 1, 1970
73.221
+0.1
0.14%
jan 1, 1971
73.343
+0.122
0.17%
jan 1, 1972
73.415
+0.071
0.1%
jan 1, 1973
73.439
+0.024
0.03%
jan 1, 1974
73.682
+0.243
0.33%
jan 1, 1975
73.808
+0.126
0.17%
jan 1, 1976
74.075
+0.267
0.36%
jan 1, 1977
73.74
-0.335
-0.45%
jan 1, 1978
74.632
+0.893
1.21%
jan 1, 1979
74.393
-0.24
-0.32%
jan 1, 1980
74.219
-0.174
-0.23%
jan 1, 1981
74.102
-0.118
-0.16%
jan 1, 1982
74.23
+0.129
0.17%
jan 1, 1983
74.551
+0.321
0.43%
jan 1, 1984
74.42
-0.131
-0.18%
jan 1, 1985
74.562
+0.142
0.19%
jan 1, 1986
74.428
-0.135
-0.18%
jan 1, 1987
74.58
+0.152
0.2%
jan 1, 1988
74.691
+0.111
0.15%
jan 1, 1989
74.772
+0.08
0.11%
jan 1, 1990
74.8
+0.028
0.04%
jan 1, 1991
74.805
+0.006
0.01%
jan 1, 1992
75.158
+0.352
0.47%
jan 1, 1993
75.194
+0.036
0.05%
jan 1, 1994
75.117
-0.077
-0.1%
jan 1, 1995
75.375
+0.258
0.34%
jan 1, 1996
75.213
-0.162
-0.22%
jan 1, 1997
75.591
+0.379
0.5%
jan 1, 1998
75.945
+0.354
0.47%
jan 1, 1999
76.139
+0.194
0.26%
jan 1, 2000
76.341
+0.202
0.27%
jan 1, 2001
76.593
+0.251
0.33%
jan 1, 2002
76.793
+0.2
0.26%
jan 1, 2003
76.895
+0.102
0.13%
jan 1, 2004
77.144
+0.249
0.32%
jan 1, 2005
77.493
+0.349
0.45%
jan 1, 2006
77.844
+0.351
0.45%
jan 1, 2007
78.095
+0.251
0.32%
jan 1, 2008
78.195
+0.1
0.13%
jan 1, 2009
78.446
+0.251
0.32%
jan 1, 2010
78.598
+0.151
0.19%
jan 1, 2011
79.1
+0.502
0.64%
jan 1, 2012
79.8
+0.7
0.88%
jan 1, 2013
80.051
+0.251
0.31%
jan 1, 2014
80.3
+0.249
0.31%
jan 1, 2015
80.549
+0.249
0.31%
Ranking of countries by current statistics by years


Comments: