29
/
en
AIzaSyAYiBZKx7MnpbEhh9jyipgxe19OcubqV5w
April 1, 2024
205486
Namibia
NAM
true
2
1
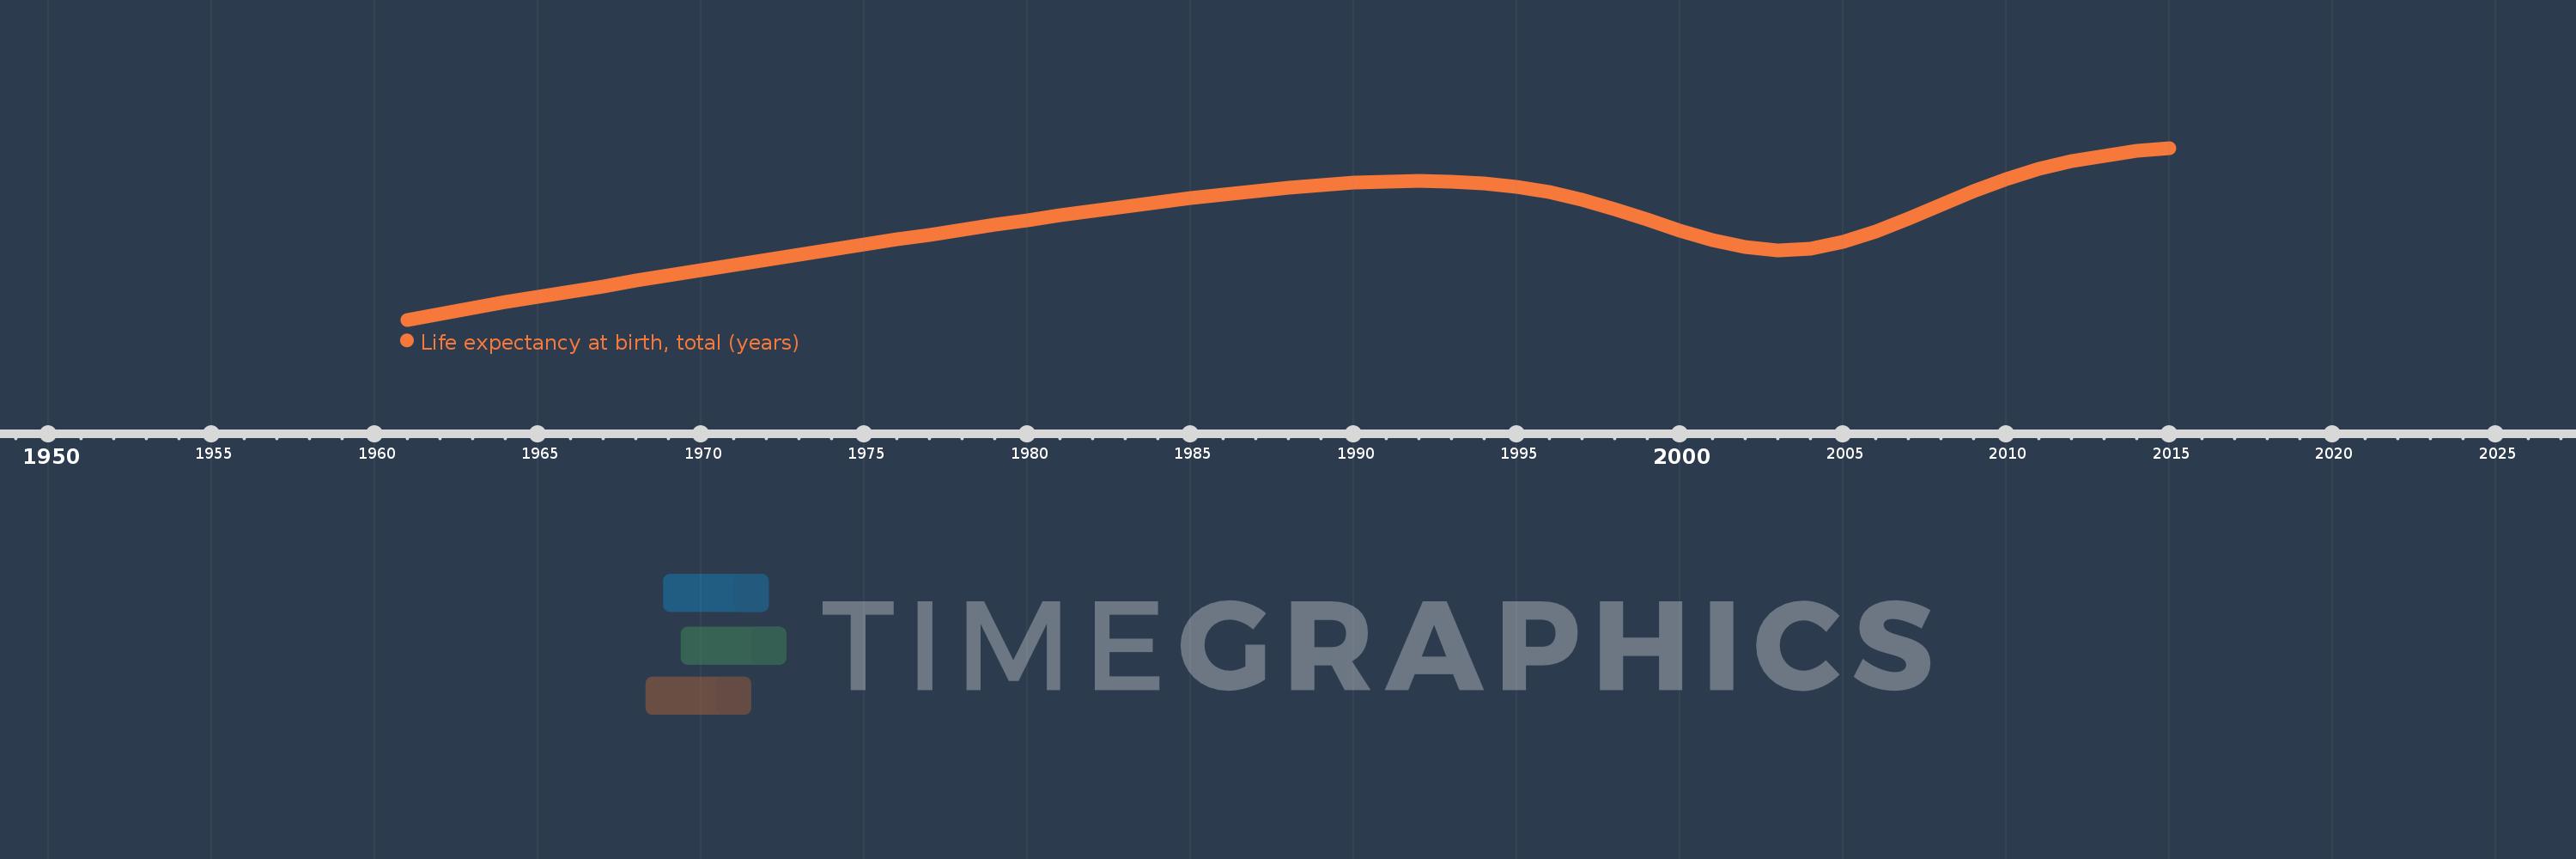
Life expectancy at birth, total (years)
2015,2014,2013,2012,2011,2010,2009,2008,2007,2006,2005,2004,2003,2002,2001,2000,1999,1998,1997,1996,1995,1994,1993,1992,1991,1990,1989,1988,1987,1986,1985,1984,1983,1982,1981,1980,1979,1978,1977,1976,1975,1974,1973,1972,1971,1970,1969,1968,1967,1966,1965,1964,1963,1962,1961
This statistics in other country:
AfghanistanAlbaniaAlgeriaAngolaAntigua and BarbudaArab WorldArgentinaArmeniaArubaAustraliaAustriaAzerbaijanBahamas, TheBahrainBangladeshBarbadosBelarusBelgiumBelizeBeninBermudaBhutanBoliviaBosnia and HerzegovinaBotswanaBrazilBrunei DarussalamBulgariaBurkina FasoBurundiCabo VerdeCambodiaCameroonCanadaCaribbean small statesCentral African RepublicCentral Europe and the BalticsChadChannel IslandsChileChinaColombiaComorosCongo, Dem. Rep.Congo, Rep.Costa RicaCote d'IvoireCroatiaCubaCuracaoCyprusCzech RepublicDenmarkDjiboutiDominicaDominican RepublicEarly-demographic dividendEast Asia & PacificEast Asia & Pacific (excluding high income)East Asia & Pacific (IDA & IBRD countries)EcuadorEgypt, Arab Rep.El SalvadorEquatorial GuineaEritreaEstoniaEthiopiaEuro areaEurope & Central AsiaEurope & Central Asia (excluding high income)Europe & Central Asia (IDA & IBRD countries)European UnionFaroe IslandsFijiFinlandFragile and conflict affected situationsFranceFrench PolynesiaGabonGambia, TheGeorgiaGermanyGhanaGreeceGreenlandGrenadaGuamGuatemalaGuineaGuinea-BissauGuyanaHaitiHeavily indebted poor countries (HIPC)High incomeHondurasHong Kong SAR, ChinaHungaryIBRD onlyIcelandIDA & IBRD totalIDA blendIDA onlyIDA totalIndiaIndonesiaIran, Islamic Rep.IraqIrelandIsle of ManIsraelItalyJamaicaJapanJordanKazakhstanKenyaKiribatiKorea, Dem. People’s Rep.Korea, Rep.KosovoKuwaitKyrgyz RepublicLao PDRLate-demographic dividendLatin America & Caribbean Latin America & Caribbean (excluding high income)Latin America & the Caribbean (IDA & IBRD countries)LatviaLeast developed countries: UN classificationLebanonLesothoLiberiaLibyaLiechtensteinLithuaniaLow & middle incomeLow incomeLower middle incomeLuxembourgMacao SAR, ChinaMacedonia, FYRMadagascarMalawiMalaysiaMaldivesMaliMaltaMarshall IslandsMauritaniaMauritiusMexicoMicronesia, Fed. Sts.Middle East & North AfricaMiddle East & North Africa (excluding high income)Middle East & North Africa (IDA & IBRD countries)Middle incomeMoldovaMongoliaMontenegroMoroccoMozambiqueMyanmarNamibiaNepalNetherlandsNew CaledoniaNew ZealandNicaraguaNigerNigeriaNorth AmericaNorwayOECD membersOmanOther small statesPacific island small statesPakistanPalauPanamaPapua New GuineaParaguayPeruPhilippinesPolandPortugalPost-demographic dividendPre-demographic dividendPuerto RicoQatarRomaniaRussian FederationRwandaSamoaSan MarinoSao Tome and PrincipeSaudi ArabiaSenegalSerbiaSeychellesSierra LeoneSingaporeSint Maarten (Dutch part)Slovak RepublicSloveniaSmall statesSolomon IslandsSomaliaSouth AfricaSouth AsiaSouth Asia (IDA & IBRD)South SudanSpainSri LankaSt. Kitts and NevisSt. LuciaSt. Martin (French part)St. Vincent and the GrenadinesSub-Saharan Africa Sub-Saharan Africa (excluding high income)Sub-Saharan Africa (IDA & IBRD countries)SudanSurinameSwazilandSwedenSwitzerlandSyrian Arab RepublicTajikistanTanzaniaThailandTimor-LesteTogoTongaTrinidad and TobagoTunisiaTurkeyTurkmenistanUgandaUkraineUnited Arab EmiratesUnited KingdomUnited StatesUpper middle incomeUruguayUzbekistanVanuatuVenezuela, RBVietnamVirgin Islands (U.S.)West Bank and GazaWorldYemen, Rep.ZambiaZimbabwe Timeline:
This timeline shows a graph from 1961 to 2015 of Namibia. No data until 1960. Number of actual observations by date: 55.
Source name:
World Development Indicators
Source organization:
Derived from male and female life expectancy at birth from sources such as: (1) United Nations Population Division. World Population Prospects, (2) Census reports and other statistical publications from national statistical offices, (3) Eurostat: Demographic Statistics, (4) United Nations Statistical Division. Population and Vital Statistics Reprot (various years), (5) U.S. Census Bureau: International Database, and (6) Secretariat of the Pacific Community: Statistics and Demography Programme.
Categories, topics:
Health
Last updated:
apr 23, 2017
Indicators value changes by year
At the date of observation
Value
Absolute change
Change from previous value
jan 1, 1961
46.88
+46.88
0.0%
jan 1, 1962
47.499
+0.619
1.32%
jan 1, 1963
48.101
+0.602
1.27%
jan 1, 1964
48.686
+0.585
1.22%
jan 1, 1965
49.257
+0.571
1.17%
jan 1, 1966
49.815
+0.558
1.13%
jan 1, 1967
50.365
+0.55
1.1%
jan 1, 1968
50.909
+0.544
1.08%
jan 1, 1969
51.449
+0.54
1.06%
jan 1, 1970
51.988
+0.539
1.05%
jan 1, 1971
52.527
+0.539
1.04%
jan 1, 1972
53.066
+0.539
1.03%
jan 1, 1973
53.603
+0.537
1.01%
jan 1, 1974
54.136
+0.533
0.99%
jan 1, 1975
54.665
+0.528
0.98%
jan 1, 1976
55.187
+0.522
0.96%
jan 1, 1977
55.704
+0.517
0.94%
jan 1, 1978
56.215
+0.51
0.92%
jan 1, 1979
56.715
+0.501
0.89%
jan 1, 1980
57.205
+0.49
0.86%
jan 1, 1981
57.683
+0.478
0.84%
jan 1, 1982
58.149
+0.466
0.81%
jan 1, 1983
58.602
+0.453
0.78%
jan 1, 1984
59.039
+0.436
0.74%
jan 1, 1985
59.451
+0.412
0.7%
jan 1, 1986
59.839
+0.388
0.65%
jan 1, 1987
60.205
+0.365
0.61%
jan 1, 1988
60.542
+0.337
0.56%
jan 1, 1989
60.837
+0.295
0.49%
jan 1, 1990
61.073
+0.236
0.39%
jan 1, 1991
61.225
+0.152
0.25%
jan 1, 1992
61.269
+0.044
0.07%
jan 1, 1993
61.19
-0.079
-0.13%
jan 1, 1994
60.977
-0.213
-0.35%
jan 1, 1995
60.626
-0.351
-0.58%
jan 1, 1996
60.095
-0.531
-0.88%
jan 1, 1997
59.336
-0.759
-1.26%
jan 1, 1998
58.375
-0.961
-1.62%
jan 1, 1999
57.277
-1.097
-1.88%
jan 1, 2000
56.139
-1.138
-1.99%
jan 1, 2001
55.121
-1.019
-1.81%
jan 1, 2002
54.405
-0.716
-1.3%
jan 1, 2003
54.105
-0.3
-0.55%
jan 1, 2004
54.279
+0.174
0.32%
jan 1, 2005
54.923
+0.644
1.19%
jan 1, 2006
55.977
+1.054
1.92%
jan 1, 2007
57.325
+1.347
2.41%
jan 1, 2008
58.781
+1.456
2.54%
jan 1, 2009
60.184
+1.403
2.39%
jan 1, 2010
61.441
+1.257
2.09%
jan 1, 2011
62.48
+1.039
1.69%
jan 1, 2012
63.277
+0.797
1.28%
jan 1, 2013
63.881
+0.604
0.95%
jan 1, 2014
64.344
+0.463
0.72%
jan 1, 2015
64.68
+0.336
0.52%
Ranking of countries by current statistics by years


Comments: