29
/
en
AIzaSyAYiBZKx7MnpbEhh9jyipgxe19OcubqV5w
April 1, 2024
148160
Guyana
GUY
true
2
1
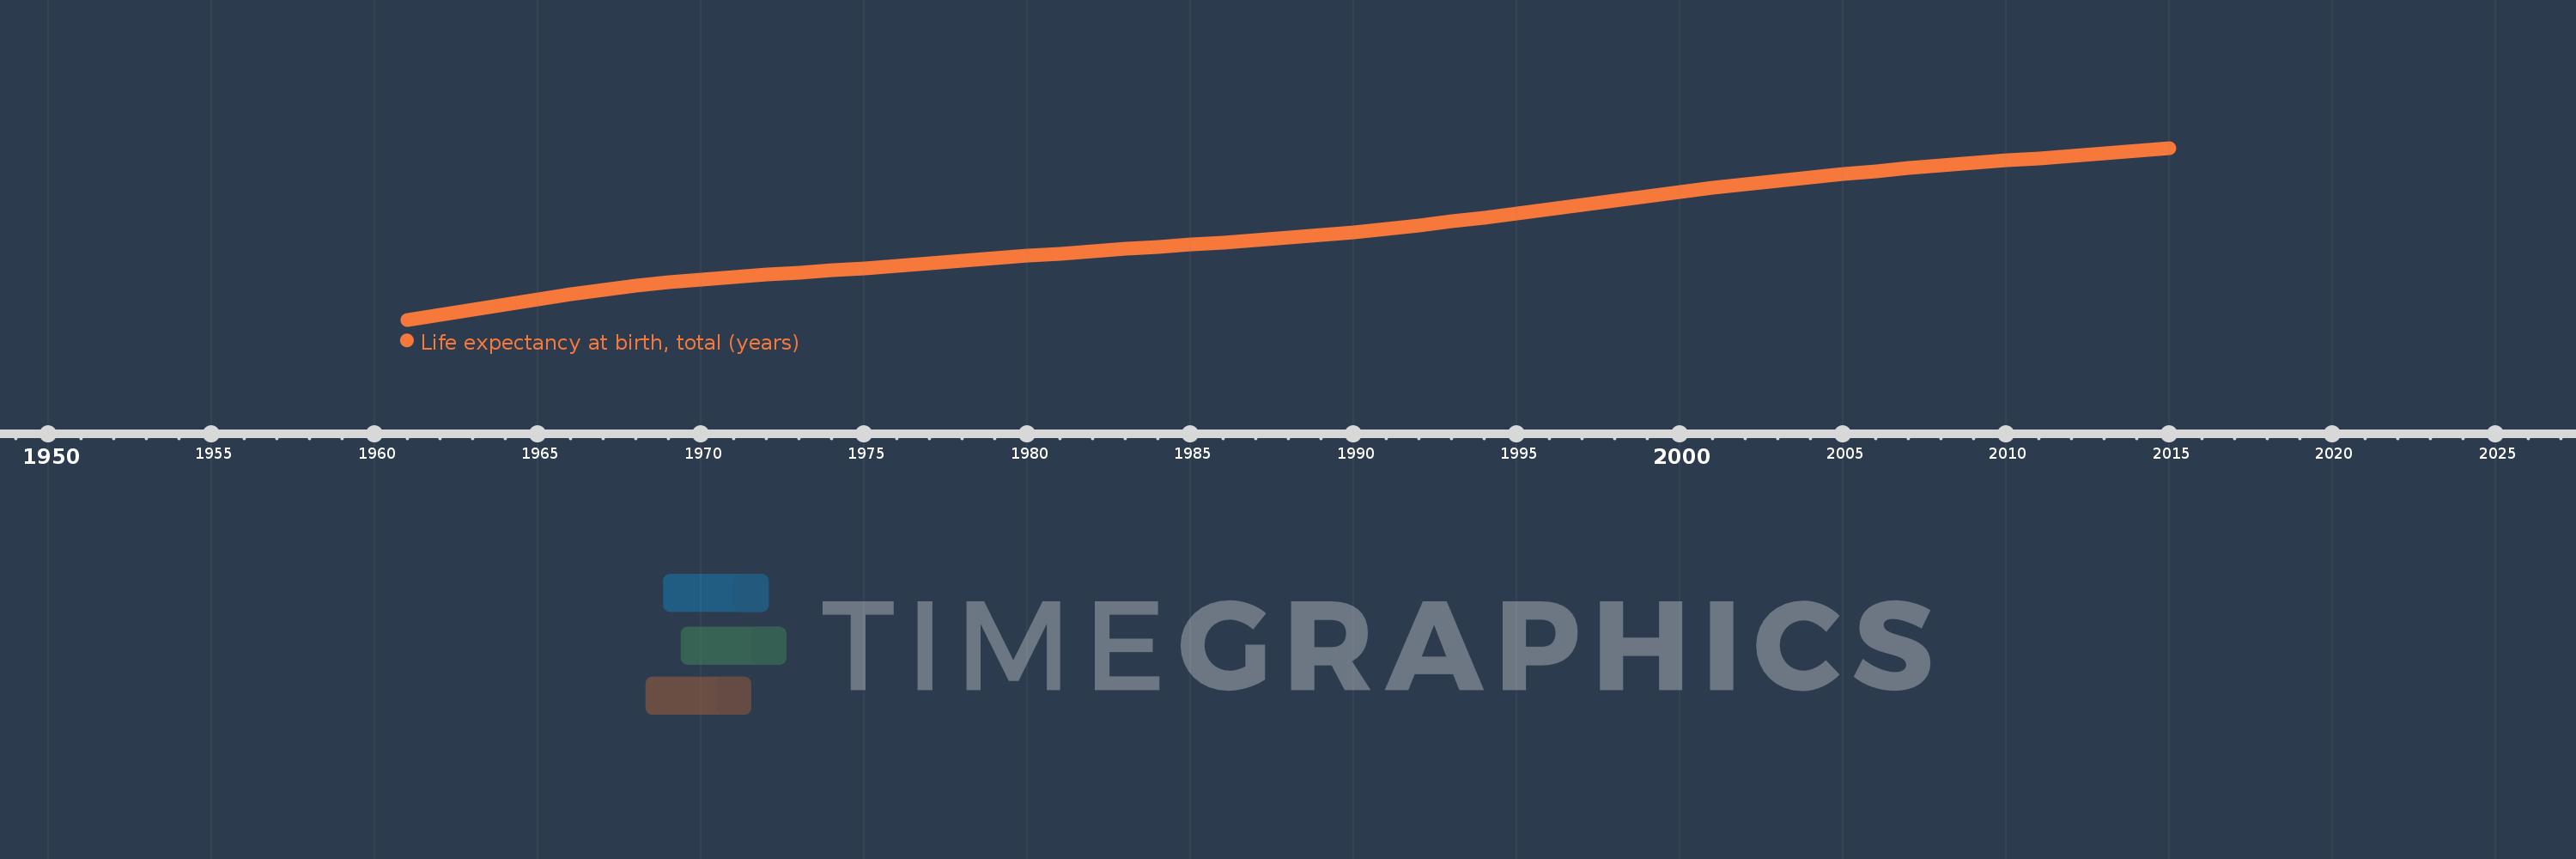
Life expectancy at birth, total (years)
2015,2014,2013,2012,2011,2010,2009,2008,2007,2006,2005,2004,2003,2002,2001,2000,1999,1998,1997,1996,1995,1994,1993,1992,1991,1990,1989,1988,1987,1986,1985,1984,1983,1982,1981,1980,1979,1978,1977,1976,1975,1974,1973,1972,1971,1970,1969,1968,1967,1966,1965,1964,1963,1962,1961
This statistics in other country:
AfghanistanAlbaniaAlgeriaAngolaAntigua and BarbudaArab WorldArgentinaArmeniaArubaAustraliaAustriaAzerbaijanBahamas, TheBahrainBangladeshBarbadosBelarusBelgiumBelizeBeninBermudaBhutanBoliviaBosnia and HerzegovinaBotswanaBrazilBrunei DarussalamBulgariaBurkina FasoBurundiCabo VerdeCambodiaCameroonCanadaCaribbean small statesCentral African RepublicCentral Europe and the BalticsChadChannel IslandsChileChinaColombiaComorosCongo, Dem. Rep.Congo, Rep.Costa RicaCote d'IvoireCroatiaCubaCuracaoCyprusCzech RepublicDenmarkDjiboutiDominicaDominican RepublicEarly-demographic dividendEast Asia & PacificEast Asia & Pacific (excluding high income)East Asia & Pacific (IDA & IBRD countries)EcuadorEgypt, Arab Rep.El SalvadorEquatorial GuineaEritreaEstoniaEthiopiaEuro areaEurope & Central AsiaEurope & Central Asia (excluding high income)Europe & Central Asia (IDA & IBRD countries)European UnionFaroe IslandsFijiFinlandFragile and conflict affected situationsFranceFrench PolynesiaGabonGambia, TheGeorgiaGermanyGhanaGreeceGreenlandGrenadaGuamGuatemalaGuineaGuinea-BissauGuyanaHaitiHeavily indebted poor countries (HIPC)High incomeHondurasHong Kong SAR, ChinaHungaryIBRD onlyIcelandIDA & IBRD totalIDA blendIDA onlyIDA totalIndiaIndonesiaIran, Islamic Rep.IraqIrelandIsle of ManIsraelItalyJamaicaJapanJordanKazakhstanKenyaKiribatiKorea, Dem. People’s Rep.Korea, Rep.KosovoKuwaitKyrgyz RepublicLao PDRLate-demographic dividendLatin America & Caribbean Latin America & Caribbean (excluding high income)Latin America & the Caribbean (IDA & IBRD countries)LatviaLeast developed countries: UN classificationLebanonLesothoLiberiaLibyaLiechtensteinLithuaniaLow & middle incomeLow incomeLower middle incomeLuxembourgMacao SAR, ChinaMacedonia, FYRMadagascarMalawiMalaysiaMaldivesMaliMaltaMarshall IslandsMauritaniaMauritiusMexicoMicronesia, Fed. Sts.Middle East & North AfricaMiddle East & North Africa (excluding high income)Middle East & North Africa (IDA & IBRD countries)Middle incomeMoldovaMongoliaMontenegroMoroccoMozambiqueMyanmarNamibiaNepalNetherlandsNew CaledoniaNew ZealandNicaraguaNigerNigeriaNorth AmericaNorwayOECD membersOmanOther small statesPacific island small statesPakistanPalauPanamaPapua New GuineaParaguayPeruPhilippinesPolandPortugalPost-demographic dividendPre-demographic dividendPuerto RicoQatarRomaniaRussian FederationRwandaSamoaSan MarinoSao Tome and PrincipeSaudi ArabiaSenegalSerbiaSeychellesSierra LeoneSingaporeSint Maarten (Dutch part)Slovak RepublicSloveniaSmall statesSolomon IslandsSomaliaSouth AfricaSouth AsiaSouth Asia (IDA & IBRD)South SudanSpainSri LankaSt. Kitts and NevisSt. LuciaSt. Martin (French part)St. Vincent and the GrenadinesSub-Saharan Africa Sub-Saharan Africa (excluding high income)Sub-Saharan Africa (IDA & IBRD countries)SudanSurinameSwazilandSwedenSwitzerlandSyrian Arab RepublicTajikistanTanzaniaThailandTimor-LesteTogoTongaTrinidad and TobagoTunisiaTurkeyTurkmenistanUgandaUkraineUnited Arab EmiratesUnited KingdomUnited StatesUpper middle incomeUruguayUzbekistanVanuatuVenezuela, RBVietnamVirgin Islands (U.S.)West Bank and GazaWorldYemen, Rep.ZambiaZimbabwe Timeline:
This timeline shows a graph from 1961 to 2015 of Guyana. No data until 1960. Number of actual observations by date: 55.
Source name:
World Development Indicators
Source organization:
Derived from male and female life expectancy at birth from sources such as: (1) United Nations Population Division. World Population Prospects, (2) Census reports and other statistical publications from national statistical offices, (3) Eurostat: Demographic Statistics, (4) United Nations Statistical Division. Population and Vital Statistics Reprot (various years), (5) U.S. Census Bureau: International Database, and (6) Secretariat of the Pacific Community: Statistics and Demography Programme.
Categories, topics:
Health
Last updated:
apr 23, 2017
Indicators value changes by year
Minimum:
60.279
jan 1, 1961
Maximum:
66.406
jan 1, 2015
At the date of observation
Value
Absolute change
Change from previous value
jan 1, 1961
60.279
+60.279
0.0%
jan 1, 1962
60.462
+0.183
0.3%
jan 1, 1963
60.647
+0.185
0.31%
jan 1, 1964
60.831
+0.184
0.3%
jan 1, 1965
61.012
+0.181
0.3%
jan 1, 1966
61.187
+0.175
0.29%
jan 1, 1967
61.348
+0.16
0.26%
jan 1, 1968
61.491
+0.144
0.23%
jan 1, 1969
61.616
+0.125
0.2%
jan 1, 1970
61.723
+0.107
0.17%
jan 1, 1971
61.813
+0.091
0.15%
jan 1, 1972
61.893
+0.08
0.13%
jan 1, 1973
61.968
+0.075
0.12%
jan 1, 1974
62.042
+0.074
0.12%
jan 1, 1975
62.12
+0.078
0.13%
jan 1, 1976
62.203
+0.083
0.13%
jan 1, 1977
62.29
+0.087
0.14%
jan 1, 1978
62.38
+0.089
0.14%
jan 1, 1979
62.468
+0.089
0.14%
jan 1, 1980
62.557
+0.089
0.14%
jan 1, 1981
62.644
+0.086
0.14%
jan 1, 1982
62.727
+0.084
0.13%
jan 1, 1983
62.808
+0.081
0.13%
jan 1, 1984
62.886
+0.078
0.12%
jan 1, 1985
62.963
+0.077
0.12%
jan 1, 1986
63.041
+0.078
0.12%
jan 1, 1987
63.123
+0.082
0.13%
jan 1, 1988
63.21
+0.088
0.14%
jan 1, 1989
63.305
+0.095
0.15%
jan 1, 1990
63.409
+0.104
0.16%
jan 1, 1991
63.523
+0.114
0.18%
jan 1, 1992
63.649
+0.125
0.2%
jan 1, 1993
63.783
+0.135
0.21%
jan 1, 1994
63.925
+0.142
0.22%
jan 1, 1995
64.073
+0.148
0.23%
jan 1, 1996
64.226
+0.152
0.24%
jan 1, 1997
64.379
+0.154
0.24%
jan 1, 1998
64.533
+0.153
0.24%
jan 1, 1999
64.685
+0.152
0.24%
jan 1, 2000
64.832
+0.147
0.23%
jan 1, 2001
64.973
+0.141
0.22%
jan 1, 2002
65.108
+0.135
0.21%
jan 1, 2003
65.235
+0.128
0.2%
jan 1, 2004
65.358
+0.122
0.19%
jan 1, 2005
65.474
+0.116
0.18%
jan 1, 2006
65.583
+0.109
0.17%
jan 1, 2007
65.685
+0.102
0.16%
jan 1, 2008
65.78
+0.095
0.14%
jan 1, 2009
65.87
+0.09
0.14%
jan 1, 2010
65.957
+0.087
0.13%
jan 1, 2011
66.043
+0.086
0.13%
jan 1, 2012
66.129
+0.086
0.13%
jan 1, 2013
66.217
+0.088
0.13%
jan 1, 2014
66.31
+0.093
0.14%
jan 1, 2015
66.406
+0.096
0.15%
Ranking of countries by current statistics by years


Comments: