29
/
en
AIzaSyAYiBZKx7MnpbEhh9jyipgxe19OcubqV5w
April 1, 2024
144616
Guatemala
GTM
true
2
1
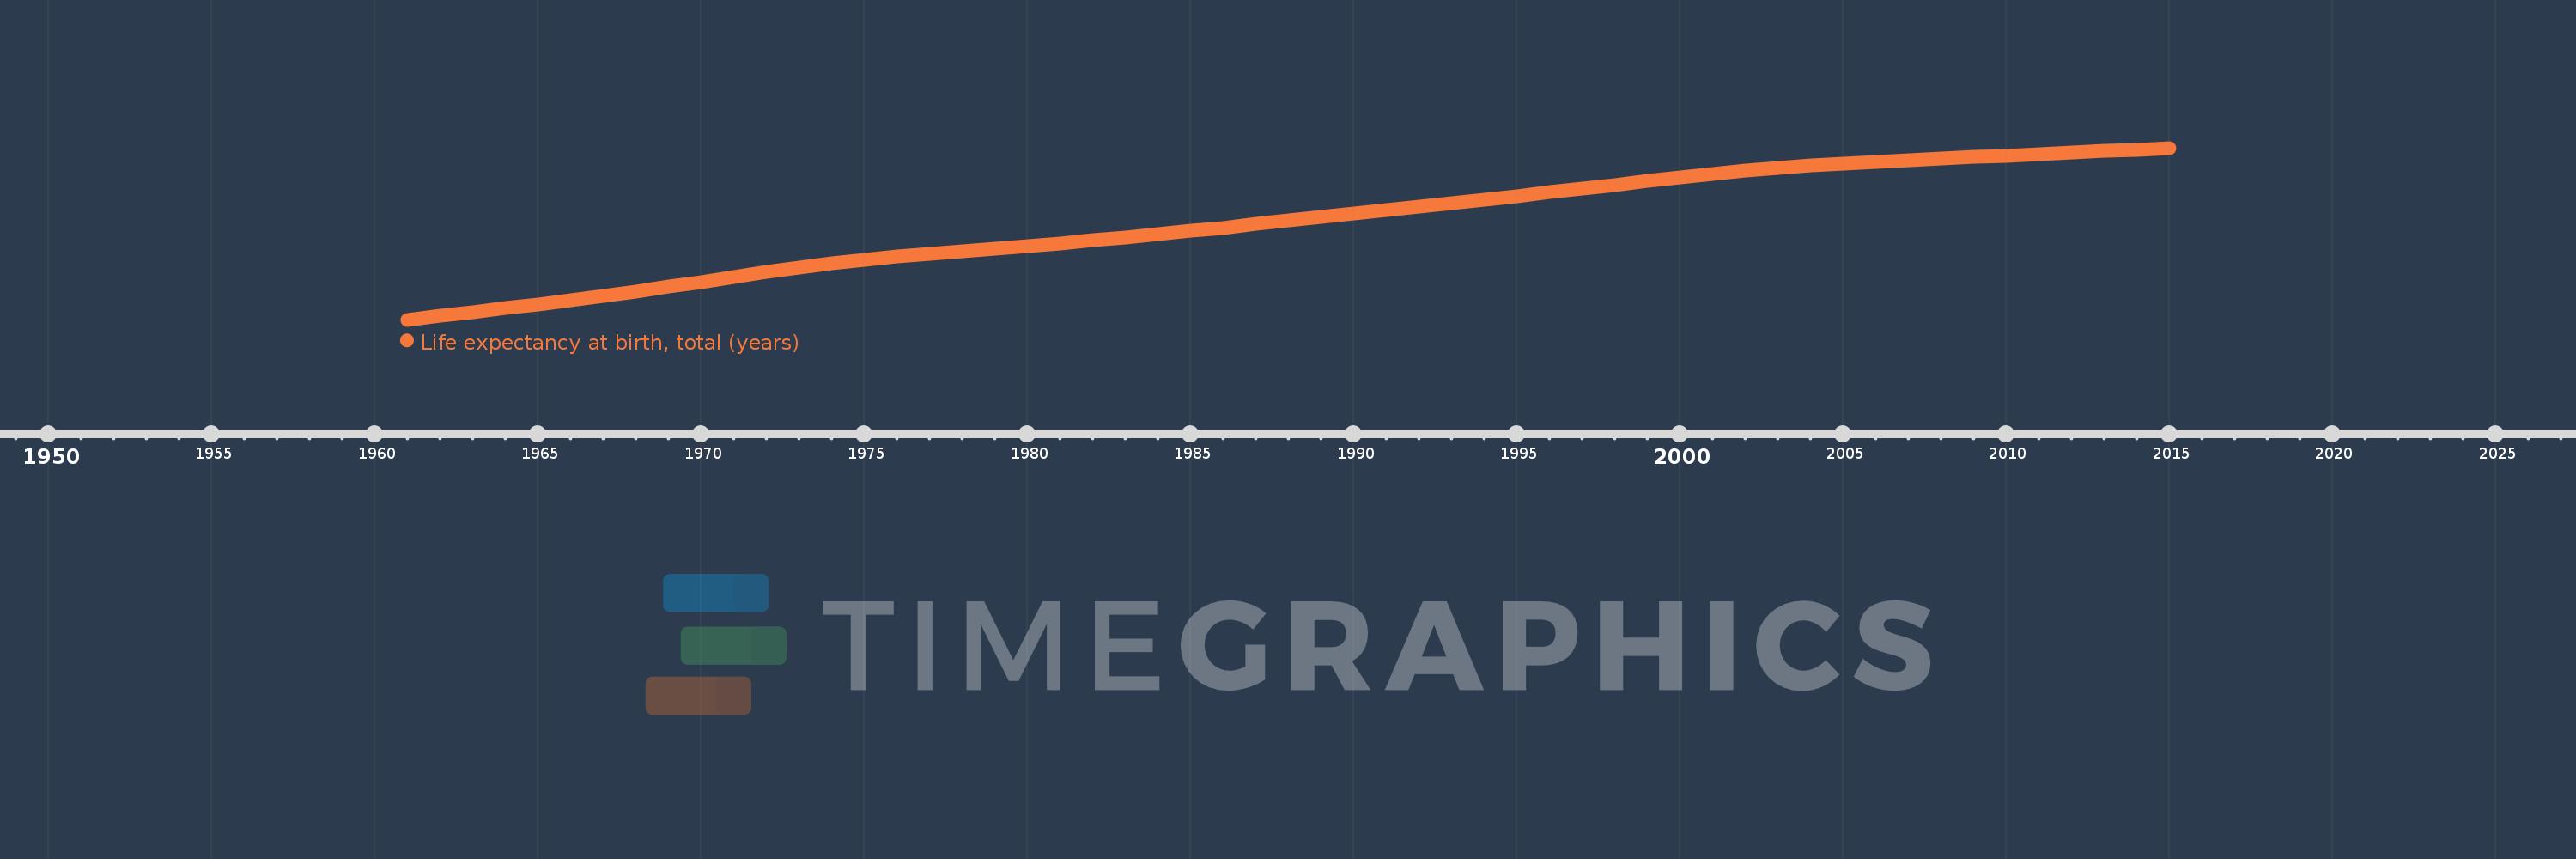
Life expectancy at birth, total (years)
2015,2014,2013,2012,2011,2010,2009,2008,2007,2006,2005,2004,2003,2002,2001,2000,1999,1998,1997,1996,1995,1994,1993,1992,1991,1990,1989,1988,1987,1986,1985,1984,1983,1982,1981,1980,1979,1978,1977,1976,1975,1974,1973,1972,1971,1970,1969,1968,1967,1966,1965,1964,1963,1962,1961
This statistics in other country:
AfghanistanAlbaniaAlgeriaAngolaAntigua and BarbudaArab WorldArgentinaArmeniaArubaAustraliaAustriaAzerbaijanBahamas, TheBahrainBangladeshBarbadosBelarusBelgiumBelizeBeninBermudaBhutanBoliviaBosnia and HerzegovinaBotswanaBrazilBrunei DarussalamBulgariaBurkina FasoBurundiCabo VerdeCambodiaCameroonCanadaCaribbean small statesCentral African RepublicCentral Europe and the BalticsChadChannel IslandsChileChinaColombiaComorosCongo, Dem. Rep.Congo, Rep.Costa RicaCote d'IvoireCroatiaCubaCuracaoCyprusCzech RepublicDenmarkDjiboutiDominicaDominican RepublicEarly-demographic dividendEast Asia & PacificEast Asia & Pacific (excluding high income)East Asia & Pacific (IDA & IBRD countries)EcuadorEgypt, Arab Rep.El SalvadorEquatorial GuineaEritreaEstoniaEthiopiaEuro areaEurope & Central AsiaEurope & Central Asia (excluding high income)Europe & Central Asia (IDA & IBRD countries)European UnionFaroe IslandsFijiFinlandFragile and conflict affected situationsFranceFrench PolynesiaGabonGambia, TheGeorgiaGermanyGhanaGreeceGreenlandGrenadaGuamGuatemalaGuineaGuinea-BissauGuyanaHaitiHeavily indebted poor countries (HIPC)High incomeHondurasHong Kong SAR, ChinaHungaryIBRD onlyIcelandIDA & IBRD totalIDA blendIDA onlyIDA totalIndiaIndonesiaIran, Islamic Rep.IraqIrelandIsle of ManIsraelItalyJamaicaJapanJordanKazakhstanKenyaKiribatiKorea, Dem. People’s Rep.Korea, Rep.KosovoKuwaitKyrgyz RepublicLao PDRLate-demographic dividendLatin America & Caribbean Latin America & Caribbean (excluding high income)Latin America & the Caribbean (IDA & IBRD countries)LatviaLeast developed countries: UN classificationLebanonLesothoLiberiaLibyaLiechtensteinLithuaniaLow & middle incomeLow incomeLower middle incomeLuxembourgMacao SAR, ChinaMacedonia, FYRMadagascarMalawiMalaysiaMaldivesMaliMaltaMarshall IslandsMauritaniaMauritiusMexicoMicronesia, Fed. Sts.Middle East & North AfricaMiddle East & North Africa (excluding high income)Middle East & North Africa (IDA & IBRD countries)Middle incomeMoldovaMongoliaMontenegroMoroccoMozambiqueMyanmarNamibiaNepalNetherlandsNew CaledoniaNew ZealandNicaraguaNigerNigeriaNorth AmericaNorwayOECD membersOmanOther small statesPacific island small statesPakistanPalauPanamaPapua New GuineaParaguayPeruPhilippinesPolandPortugalPost-demographic dividendPre-demographic dividendPuerto RicoQatarRomaniaRussian FederationRwandaSamoaSan MarinoSao Tome and PrincipeSaudi ArabiaSenegalSerbiaSeychellesSierra LeoneSingaporeSint Maarten (Dutch part)Slovak RepublicSloveniaSmall statesSolomon IslandsSomaliaSouth AfricaSouth AsiaSouth Asia (IDA & IBRD)South SudanSpainSri LankaSt. Kitts and NevisSt. LuciaSt. Martin (French part)St. Vincent and the GrenadinesSub-Saharan Africa Sub-Saharan Africa (excluding high income)Sub-Saharan Africa (IDA & IBRD countries)SudanSurinameSwazilandSwedenSwitzerlandSyrian Arab RepublicTajikistanTanzaniaThailandTimor-LesteTogoTongaTrinidad and TobagoTunisiaTurkeyTurkmenistanUgandaUkraineUnited Arab EmiratesUnited KingdomUnited StatesUpper middle incomeUruguayUzbekistanVanuatuVenezuela, RBVietnamVirgin Islands (U.S.)West Bank and GazaWorldYemen, Rep.ZambiaZimbabwe Timeline:
This timeline shows a graph from 1961 to 2015 of Guatemala. No data until 1960. Number of actual observations by date: 55.
Source name:
World Development Indicators
Source organization:
Derived from male and female life expectancy at birth from sources such as: (1) United Nations Population Division. World Population Prospects, (2) Census reports and other statistical publications from national statistical offices, (3) Eurostat: Demographic Statistics, (4) United Nations Statistical Division. Population and Vital Statistics Reprot (various years), (5) U.S. Census Bureau: International Database, and (6) Secretariat of the Pacific Community: Statistics and Demography Programme.
Categories, topics:
Health
Last updated:
apr 23, 2017
Indicators value changes by year
Minimum:
45.532
jan 1, 1961
Maximum:
71.722
jan 1, 2015
At the date of observation
Value
Absolute change
Change from previous value
jan 1, 1961
45.532
+45.532
0.0%
jan 1, 1962
46.104
+0.572
1.26%
jan 1, 1963
46.688
+0.584
1.27%
jan 1, 1964
47.283
+0.594
1.27%
jan 1, 1965
47.887
+0.604
1.28%
jan 1, 1966
48.509
+0.622
1.3%
jan 1, 1967
49.161
+0.652
1.35%
jan 1, 1968
49.849
+0.688
1.4%
jan 1, 1969
50.569
+0.72
1.44%
jan 1, 1970
51.31
+0.741
1.47%
jan 1, 1971
52.053
+0.743
1.45%
jan 1, 1972
52.774
+0.721
1.38%
jan 1, 1973
53.452
+0.678
1.29%
jan 1, 1974
54.074
+0.622
1.16%
jan 1, 1975
54.634
+0.56
1.04%
jan 1, 1976
55.133
+0.499
0.91%
jan 1, 1977
55.579
+0.446
0.81%
jan 1, 1978
55.992
+0.413
0.74%
jan 1, 1979
56.392
+0.4
0.71%
jan 1, 1980
56.791
+0.399
0.71%
jan 1, 1981
57.201
+0.411
0.72%
jan 1, 1982
57.633
+0.431
0.75%
jan 1, 1983
58.086
+0.453
0.79%
jan 1, 1984
58.559
+0.473
0.81%
jan 1, 1985
59.054
+0.495
0.85%
jan 1, 1986
59.568
+0.514
0.87%
jan 1, 1987
60.097
+0.529
0.89%
jan 1, 1988
60.633
+0.536
0.89%
jan 1, 1989
61.17
+0.537
0.89%
jan 1, 1990
61.705
+0.535
0.87%
jan 1, 1991
62.238
+0.534
0.87%
jan 1, 1992
62.773
+0.535
0.86%
jan 1, 1993
63.312
+0.539
0.86%
jan 1, 1994
63.856
+0.545
0.86%
jan 1, 1995
64.407
+0.55
0.86%
jan 1, 1996
64.963
+0.556
0.86%
jan 1, 1997
65.527
+0.564
0.87%
jan 1, 1998
66.096
+0.569
0.87%
jan 1, 1999
66.662
+0.566
0.86%
jan 1, 2000
67.215
+0.554
0.83%
jan 1, 2001
67.743
+0.528
0.78%
jan 1, 2002
68.227
+0.485
0.72%
jan 1, 2003
68.661
+0.434
0.64%
jan 1, 2004
69.041
+0.38
0.55%
jan 1, 2005
69.367
+0.326
0.47%
jan 1, 2006
69.646
+0.279
0.4%
jan 1, 2007
69.888
+0.242
0.35%
jan 1, 2008
70.111
+0.223
0.32%
jan 1, 2009
70.328
+0.217
0.31%
jan 1, 2010
70.548
+0.219
0.31%
jan 1, 2011
70.775
+0.228
0.32%
jan 1, 2012
71.01
+0.235
0.33%
jan 1, 2013
71.249
+0.239
0.34%
jan 1, 2014
71.486
+0.237
0.33%
jan 1, 2015
71.722
+0.236
0.33%
Ranking of countries by current statistics by years


Comments: