29
/
en
AIzaSyAYiBZKx7MnpbEhh9jyipgxe19OcubqV5w
April 1, 2024
234831
Saudi Arabia
SAU
true
2
1
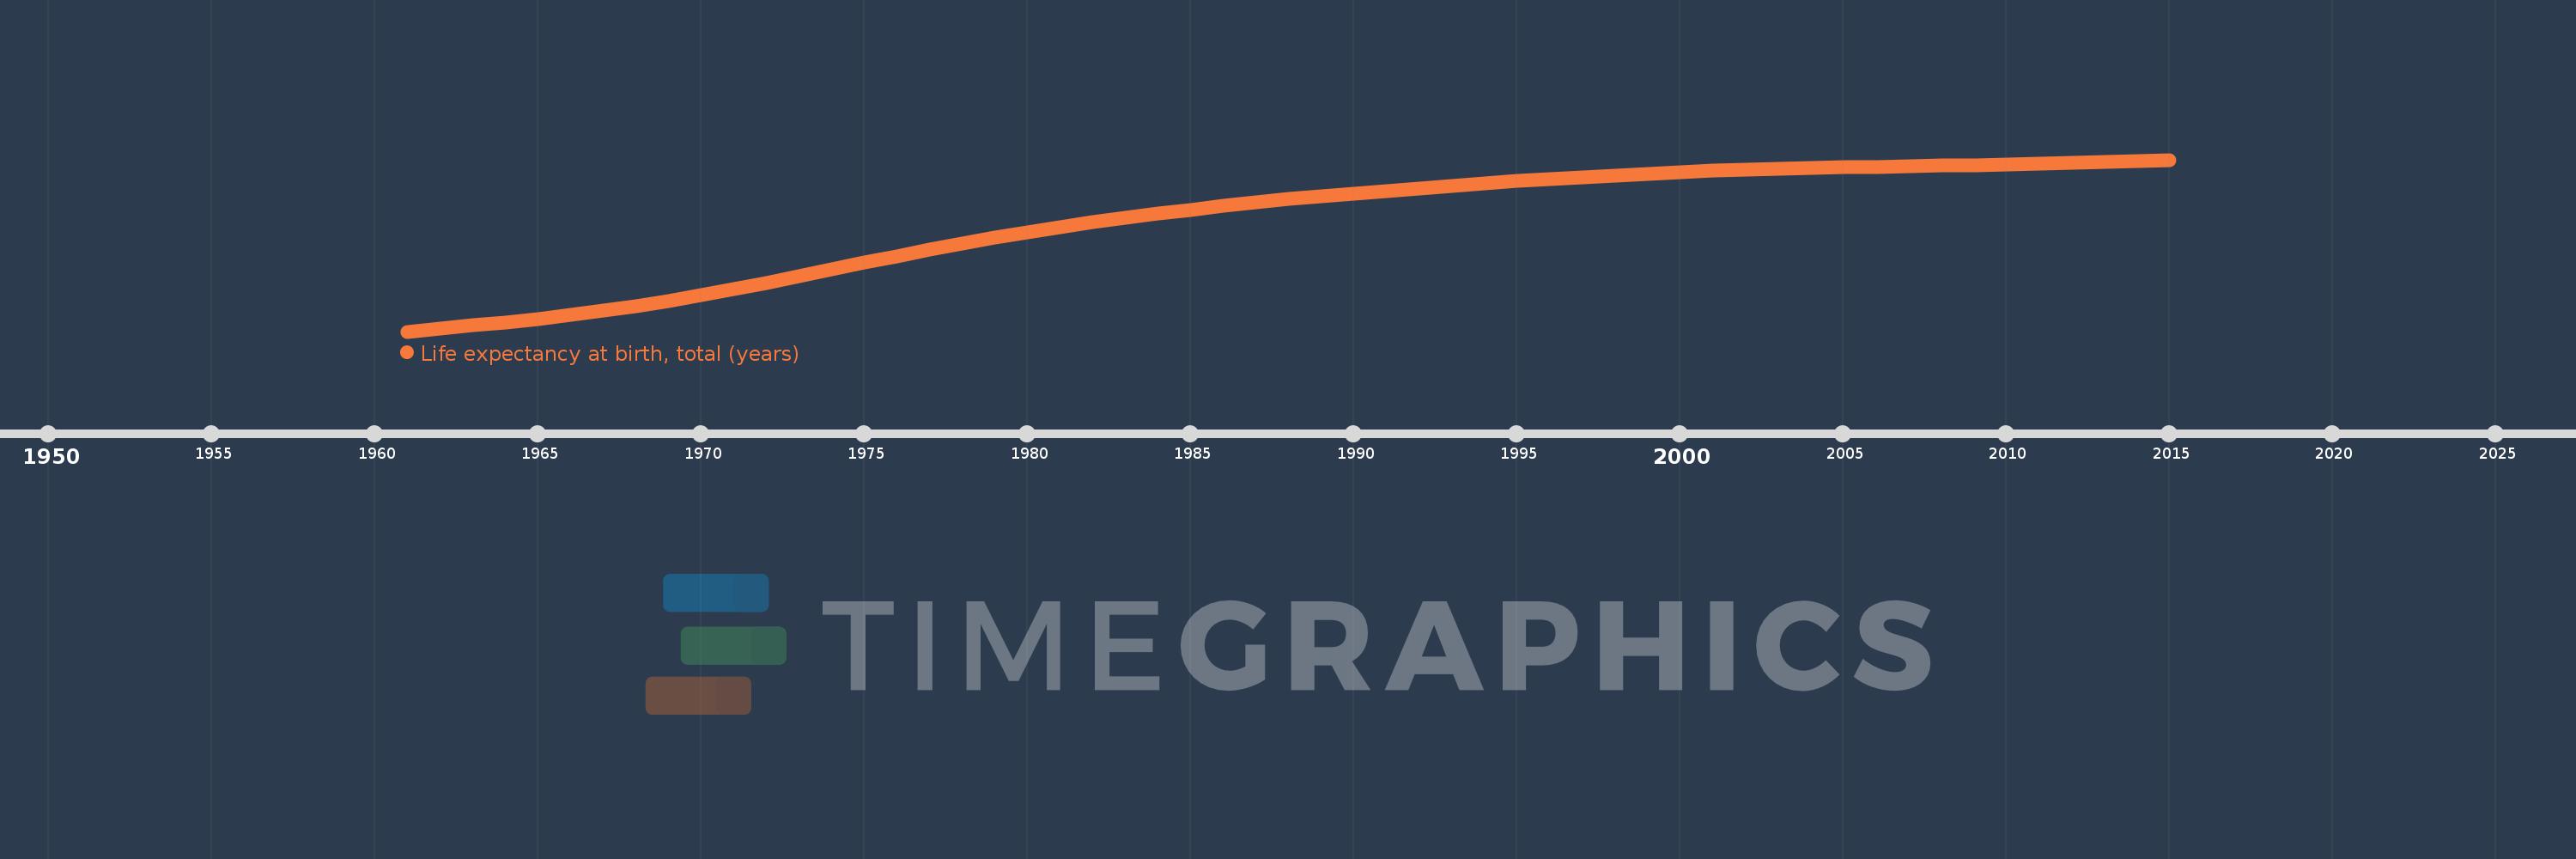
Life expectancy at birth, total (years)
2015,2014,2013,2012,2011,2010,2009,2008,2007,2006,2005,2004,2003,2002,2001,2000,1999,1998,1997,1996,1995,1994,1993,1992,1991,1990,1989,1988,1987,1986,1985,1984,1983,1982,1981,1980,1979,1978,1977,1976,1975,1974,1973,1972,1971,1970,1969,1968,1967,1966,1965,1964,1963,1962,1961
This statistics in other country:
AfghanistanAlbaniaAlgeriaAngolaAntigua and BarbudaArab WorldArgentinaArmeniaArubaAustraliaAustriaAzerbaijanBahamas, TheBahrainBangladeshBarbadosBelarusBelgiumBelizeBeninBermudaBhutanBoliviaBosnia and HerzegovinaBotswanaBrazilBrunei DarussalamBulgariaBurkina FasoBurundiCabo VerdeCambodiaCameroonCanadaCaribbean small statesCentral African RepublicCentral Europe and the BalticsChadChannel IslandsChileChinaColombiaComorosCongo, Dem. Rep.Congo, Rep.Costa RicaCote d'IvoireCroatiaCubaCuracaoCyprusCzech RepublicDenmarkDjiboutiDominicaDominican RepublicEarly-demographic dividendEast Asia & PacificEast Asia & Pacific (excluding high income)East Asia & Pacific (IDA & IBRD countries)EcuadorEgypt, Arab Rep.El SalvadorEquatorial GuineaEritreaEstoniaEthiopiaEuro areaEurope & Central AsiaEurope & Central Asia (excluding high income)Europe & Central Asia (IDA & IBRD countries)European UnionFaroe IslandsFijiFinlandFragile and conflict affected situationsFranceFrench PolynesiaGabonGambia, TheGeorgiaGermanyGhanaGreeceGreenlandGrenadaGuamGuatemalaGuineaGuinea-BissauGuyanaHaitiHeavily indebted poor countries (HIPC)High incomeHondurasHong Kong SAR, ChinaHungaryIBRD onlyIcelandIDA & IBRD totalIDA blendIDA onlyIDA totalIndiaIndonesiaIran, Islamic Rep.IraqIrelandIsle of ManIsraelItalyJamaicaJapanJordanKazakhstanKenyaKiribatiKorea, Dem. People’s Rep.Korea, Rep.KosovoKuwaitKyrgyz RepublicLao PDRLate-demographic dividendLatin America & Caribbean Latin America & Caribbean (excluding high income)Latin America & the Caribbean (IDA & IBRD countries)LatviaLeast developed countries: UN classificationLebanonLesothoLiberiaLibyaLiechtensteinLithuaniaLow & middle incomeLow incomeLower middle incomeLuxembourgMacao SAR, ChinaMacedonia, FYRMadagascarMalawiMalaysiaMaldivesMaliMaltaMarshall IslandsMauritaniaMauritiusMexicoMicronesia, Fed. Sts.Middle East & North AfricaMiddle East & North Africa (excluding high income)Middle East & North Africa (IDA & IBRD countries)Middle incomeMoldovaMongoliaMontenegroMoroccoMozambiqueMyanmarNamibiaNepalNetherlandsNew CaledoniaNew ZealandNicaraguaNigerNigeriaNorth AmericaNorwayOECD membersOmanOther small statesPacific island small statesPakistanPalauPanamaPapua New GuineaParaguayPeruPhilippinesPolandPortugalPost-demographic dividendPre-demographic dividendPuerto RicoQatarRomaniaRussian FederationRwandaSamoaSan MarinoSao Tome and PrincipeSaudi ArabiaSenegalSerbiaSeychellesSierra LeoneSingaporeSint Maarten (Dutch part)Slovak RepublicSloveniaSmall statesSolomon IslandsSomaliaSouth AfricaSouth AsiaSouth Asia (IDA & IBRD)South SudanSpainSri LankaSt. Kitts and NevisSt. LuciaSt. Martin (French part)St. Vincent and the GrenadinesSub-Saharan Africa Sub-Saharan Africa (excluding high income)Sub-Saharan Africa (IDA & IBRD countries)SudanSurinameSwazilandSwedenSwitzerlandSyrian Arab RepublicTajikistanTanzaniaThailandTimor-LesteTogoTongaTrinidad and TobagoTunisiaTurkeyTurkmenistanUgandaUkraineUnited Arab EmiratesUnited KingdomUnited StatesUpper middle incomeUruguayUzbekistanVanuatuVenezuela, RBVietnamVirgin Islands (U.S.)West Bank and GazaWorldYemen, Rep.ZambiaZimbabwe Timeline:
This timeline shows a graph from 1961 to 2015 of Saudi Arabia. No data until 1960. Number of actual observations by date: 55.
Source name:
World Development Indicators
Source organization:
Derived from male and female life expectancy at birth from sources such as: (1) United Nations Population Division. World Population Prospects, (2) Census reports and other statistical publications from national statistical offices, (3) Eurostat: Demographic Statistics, (4) United Nations Statistical Division. Population and Vital Statistics Reprot (various years), (5) U.S. Census Bureau: International Database, and (6) Secretariat of the Pacific Community: Statistics and Demography Programme.
Categories, topics:
Health
Last updated:
apr 23, 2017
Indicators value changes by year
Minimum:
45.666
jan 1, 1961
Maximum:
74.337
jan 1, 2015
At the date of observation
Value
Absolute change
Change from previous value
jan 1, 1961
45.666
+45.666
0.0%
jan 1, 1962
46.174
+0.508
1.11%
jan 1, 1963
46.695
+0.52
1.13%
jan 1, 1964
47.236
+0.542
1.16%
jan 1, 1965
47.811
+0.575
1.22%
jan 1, 1966
48.438
+0.627
1.31%
jan 1, 1967
49.137
+0.699
1.44%
jan 1, 1968
49.915
+0.778
1.58%
jan 1, 1969
50.775
+0.86
1.72%
jan 1, 1970
51.714
+0.939
1.85%
jan 1, 1971
52.725
+1.011
1.95%
jan 1, 1972
53.797
+1.073
2.03%
jan 1, 1973
54.909
+1.112
2.07%
jan 1, 1974
56.036
+1.127
2.05%
jan 1, 1975
57.158
+1.122
2.0%
jan 1, 1976
58.257
+1.099
1.92%
jan 1, 1977
59.319
+1.062
1.82%
jan 1, 1978
60.341
+1.022
1.72%
jan 1, 1979
61.318
+0.977
1.62%
jan 1, 1980
62.241
+0.923
1.51%
jan 1, 1981
63.105
+0.864
1.39%
jan 1, 1982
63.908
+0.804
1.27%
jan 1, 1983
64.659
+0.75
1.17%
jan 1, 1984
65.362
+0.703
1.09%
jan 1, 1985
66.021
+0.659
1.01%
jan 1, 1986
66.637
+0.616
0.93%
jan 1, 1987
67.212
+0.575
0.86%
jan 1, 1988
67.748
+0.536
0.8%
jan 1, 1989
68.25
+0.501
0.74%
jan 1, 1990
68.721
+0.472
0.69%
jan 1, 1991
69.167
+0.446
0.65%
jan 1, 1992
69.592
+0.425
0.61%
jan 1, 1993
69.998
+0.406
0.58%
jan 1, 1994
70.386
+0.388
0.55%
jan 1, 1995
70.756
+0.37
0.53%
jan 1, 1996
71.109
+0.353
0.5%
jan 1, 1997
71.443
+0.334
0.47%
jan 1, 1998
71.754
+0.311
0.44%
jan 1, 1999
72.04
+0.286
0.4%
jan 1, 2000
72.299
+0.259
0.36%
jan 1, 2001
72.526
+0.227
0.31%
jan 1, 2002
72.717
+0.19
0.26%
jan 1, 2003
72.871
+0.155
0.21%
jan 1, 2004
72.995
+0.123
0.17%
jan 1, 2005
73.093
+0.099
0.14%
jan 1, 2006
73.177
+0.084
0.11%
jan 1, 2007
73.258
+0.081
0.11%
jan 1, 2008
73.345
+0.087
0.12%
jan 1, 2009
73.446
+0.101
0.14%
jan 1, 2010
73.564
+0.119
0.16%
jan 1, 2011
73.702
+0.137
0.19%
jan 1, 2012
73.855
+0.153
0.21%
jan 1, 2013
74.016
+0.161
0.22%
jan 1, 2014
74.178
+0.162
0.22%
jan 1, 2015
74.337
+0.16
0.22%
Ranking of countries by current statistics by years


Comments: