29
/
en
AIzaSyAYiBZKx7MnpbEhh9jyipgxe19OcubqV5w
April 1, 2024
31773
Europe & Central Asia (excluding high income)
ECA
false
2
1
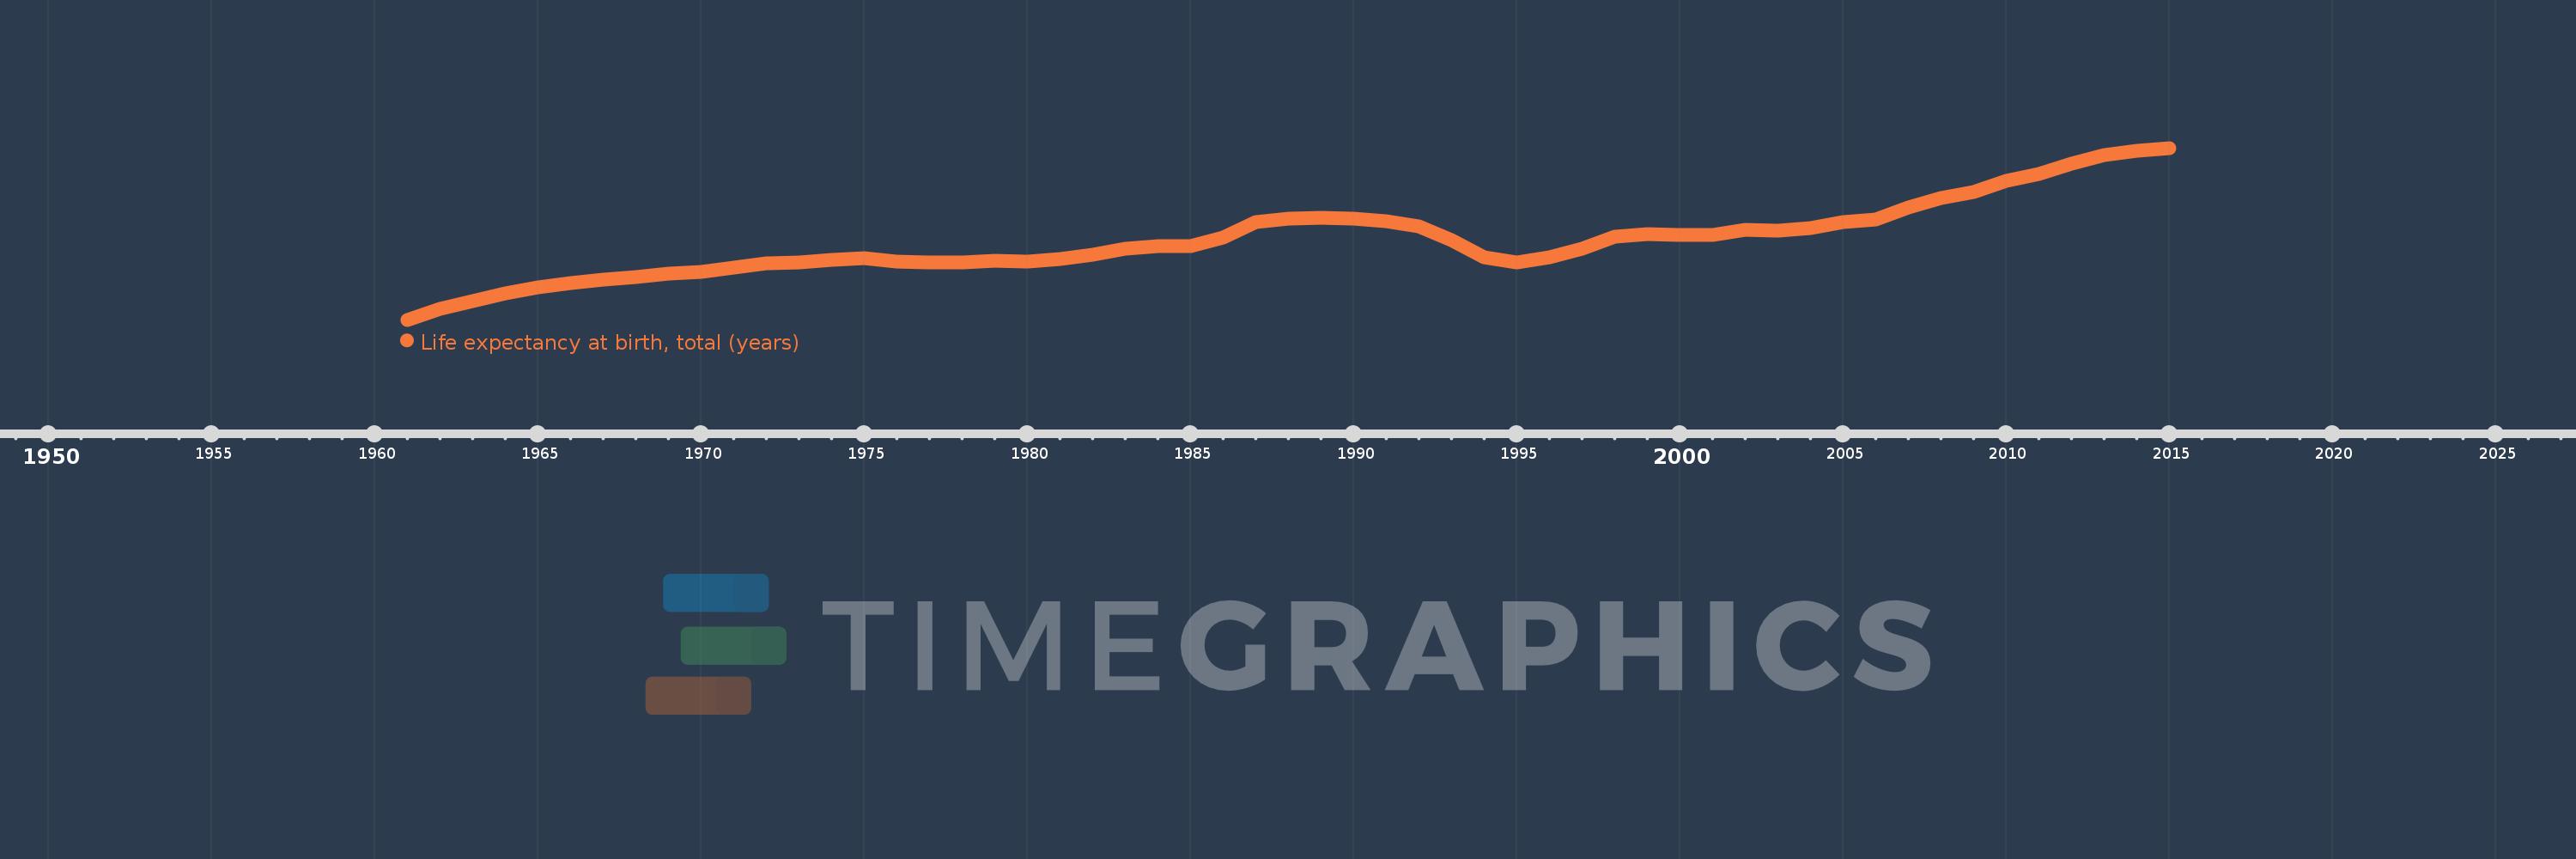
Life expectancy at birth, total (years)
2015,2014,2013,2012,2011,2010,2009,2008,2007,2006,2005,2004,2003,2002,2001,2000,1999,1998,1997,1996,1995,1994,1993,1992,1991,1990,1989,1988,1987,1986,1985,1984,1983,1982,1981,1980,1979,1978,1977,1976,1975,1974,1973,1972,1971,1970,1969,1968,1967,1966,1965,1964,1963,1962,1961
This statistics in other country:
AfghanistanAlbaniaAlgeriaAngolaAntigua and BarbudaArab WorldArgentinaArmeniaArubaAustraliaAustriaAzerbaijanBahamas, TheBahrainBangladeshBarbadosBelarusBelgiumBelizeBeninBermudaBhutanBoliviaBosnia and HerzegovinaBotswanaBrazilBrunei DarussalamBulgariaBurkina FasoBurundiCabo VerdeCambodiaCameroonCanadaCaribbean small statesCentral African RepublicCentral Europe and the BalticsChadChannel IslandsChileChinaColombiaComorosCongo, Dem. Rep.Congo, Rep.Costa RicaCote d'IvoireCroatiaCubaCuracaoCyprusCzech RepublicDenmarkDjiboutiDominicaDominican RepublicEarly-demographic dividendEast Asia & PacificEast Asia & Pacific (excluding high income)East Asia & Pacific (IDA & IBRD countries)EcuadorEgypt, Arab Rep.El SalvadorEquatorial GuineaEritreaEstoniaEthiopiaEuro areaEurope & Central AsiaEurope & Central Asia (excluding high income)Europe & Central Asia (IDA & IBRD countries)European UnionFaroe IslandsFijiFinlandFragile and conflict affected situationsFranceFrench PolynesiaGabonGambia, TheGeorgiaGermanyGhanaGreeceGreenlandGrenadaGuamGuatemalaGuineaGuinea-BissauGuyanaHaitiHeavily indebted poor countries (HIPC)High incomeHondurasHong Kong SAR, ChinaHungaryIBRD onlyIcelandIDA & IBRD totalIDA blendIDA onlyIDA totalIndiaIndonesiaIran, Islamic Rep.IraqIrelandIsle of ManIsraelItalyJamaicaJapanJordanKazakhstanKenyaKiribatiKorea, Dem. People’s Rep.Korea, Rep.KosovoKuwaitKyrgyz RepublicLao PDRLate-demographic dividendLatin America & Caribbean Latin America & Caribbean (excluding high income)Latin America & the Caribbean (IDA & IBRD countries)LatviaLeast developed countries: UN classificationLebanonLesothoLiberiaLibyaLiechtensteinLithuaniaLow & middle incomeLow incomeLower middle incomeLuxembourgMacao SAR, ChinaMacedonia, FYRMadagascarMalawiMalaysiaMaldivesMaliMaltaMarshall IslandsMauritaniaMauritiusMexicoMicronesia, Fed. Sts.Middle East & North AfricaMiddle East & North Africa (excluding high income)Middle East & North Africa (IDA & IBRD countries)Middle incomeMoldovaMongoliaMontenegroMoroccoMozambiqueMyanmarNamibiaNepalNetherlandsNew CaledoniaNew ZealandNicaraguaNigerNigeriaNorth AmericaNorwayOECD membersOmanOther small statesPacific island small statesPakistanPalauPanamaPapua New GuineaParaguayPeruPhilippinesPolandPortugalPost-demographic dividendPre-demographic dividendPuerto RicoQatarRomaniaRussian FederationRwandaSamoaSan MarinoSao Tome and PrincipeSaudi ArabiaSenegalSerbiaSeychellesSierra LeoneSingaporeSint Maarten (Dutch part)Slovak RepublicSloveniaSmall statesSolomon IslandsSomaliaSouth AfricaSouth AsiaSouth Asia (IDA & IBRD)South SudanSpainSri LankaSt. Kitts and NevisSt. LuciaSt. Martin (French part)St. Vincent and the GrenadinesSub-Saharan Africa Sub-Saharan Africa (excluding high income)Sub-Saharan Africa (IDA & IBRD countries)SudanSurinameSwazilandSwedenSwitzerlandSyrian Arab RepublicTajikistanTanzaniaThailandTimor-LesteTogoTongaTrinidad and TobagoTunisiaTurkeyTurkmenistanUgandaUkraineUnited Arab EmiratesUnited KingdomUnited StatesUpper middle incomeUruguayUzbekistanVanuatuVenezuela, RBVietnamVirgin Islands (U.S.)West Bank and GazaWorldYemen, Rep.ZambiaZimbabwe Timeline:
This timeline shows a graph from 1961 to 2015 of Europe & Central Asia (excluding high income). No data until 1960. Number of actual observations by date: 55.
Source name:
World Development Indicators
Source organization:
Derived from male and female life expectancy at birth from sources such as: (1) United Nations Population Division. World Population Prospects, (2) Census reports and other statistical publications from national statistical offices, (3) Eurostat: Demographic Statistics, (4) United Nations Statistical Division. Population and Vital Statistics Reprot (various years), (5) U.S. Census Bureau: International Database, and (6) Secretariat of the Pacific Community: Statistics and Demography Programme.
Categories, topics:
Health
Last updated:
apr 23, 2017
Indicators value changes by year
Minimum:
63.381
jan 1, 1961
Maximum:
71.895
jan 1, 2015
At the date of observation
Value
Absolute change
Change from previous value
jan 1, 1961
63.381
+63.381
0.0%
jan 1, 1962
63.904
+0.523
0.83%
jan 1, 1963
64.302
+0.398
0.62%
jan 1, 1964
64.67
+0.369
0.57%
jan 1, 1965
64.973
+0.302
0.47%
jan 1, 1966
65.202
+0.229
0.35%
jan 1, 1967
65.375
+0.174
0.27%
jan 1, 1968
65.499
+0.123
0.19%
jan 1, 1969
65.647
+0.148
0.23%
jan 1, 1970
65.736
+0.089
0.14%
jan 1, 1971
65.983
+0.247
0.38%
jan 1, 1972
66.188
+0.205
0.31%
jan 1, 1973
66.231
+0.043
0.07%
jan 1, 1974
66.338
+0.107
0.16%
jan 1, 1975
66.44
+0.101
0.15%
jan 1, 1976
66.256
-0.184
-0.28%
jan 1, 1977
66.235
-0.021
-0.03%
jan 1, 1978
66.24
+0.005
0.01%
jan 1, 1979
66.305
+0.065
0.1%
jan 1, 1980
66.246
-0.059
-0.09%
jan 1, 1981
66.371
+0.125
0.19%
jan 1, 1982
66.587
+0.216
0.33%
jan 1, 1983
66.922
+0.335
0.5%
jan 1, 1984
67.044
+0.121
0.18%
jan 1, 1985
67.04
-0.004
-0.01%
jan 1, 1986
67.45
+0.41
0.61%
jan 1, 1987
68.205
+0.756
1.12%
jan 1, 1988
68.372
+0.167
0.24%
jan 1, 1989
68.44
+0.067
0.1%
jan 1, 1990
68.387
-0.052
-0.08%
jan 1, 1991
68.256
-0.131
-0.19%
jan 1, 1992
67.997
-0.26
-0.38%
jan 1, 1993
67.347
-0.65
-0.96%
jan 1, 1994
66.482
-0.866
-1.29%
jan 1, 1995
66.231
-0.25
-0.38%
jan 1, 1996
66.486
+0.255
0.38%
jan 1, 1997
66.909
+0.424
0.64%
jan 1, 1998
67.478
+0.568
0.85%
jan 1, 1999
67.621
+0.143
0.21%
jan 1, 2000
67.59
-0.031
-0.05%
jan 1, 2001
67.567
-0.023
-0.03%
jan 1, 2002
67.82
+0.253
0.37%
jan 1, 2003
67.779
-0.041
-0.06%
jan 1, 2004
67.904
+0.124
0.18%
jan 1, 2005
68.215
+0.311
0.46%
jan 1, 2006
68.336
+0.121
0.18%
jan 1, 2007
68.934
+0.598
0.87%
jan 1, 2008
69.423
+0.488
0.71%
jan 1, 2009
69.691
+0.268
0.39%
jan 1, 2010
70.274
+0.584
0.84%
jan 1, 2011
70.586
+0.312
0.44%
jan 1, 2012
71.116
+0.529
0.75%
jan 1, 2013
71.536
+0.421
0.59%
jan 1, 2014
71.736
+0.2
0.28%
jan 1, 2015
71.895
+0.159
0.22%
Ranking of countries by current statistics by years


Comments: