29
/
en
AIzaSyAYiBZKx7MnpbEhh9jyipgxe19OcubqV5w
April 1, 2024
160691
Israel
ISR
true
2
1
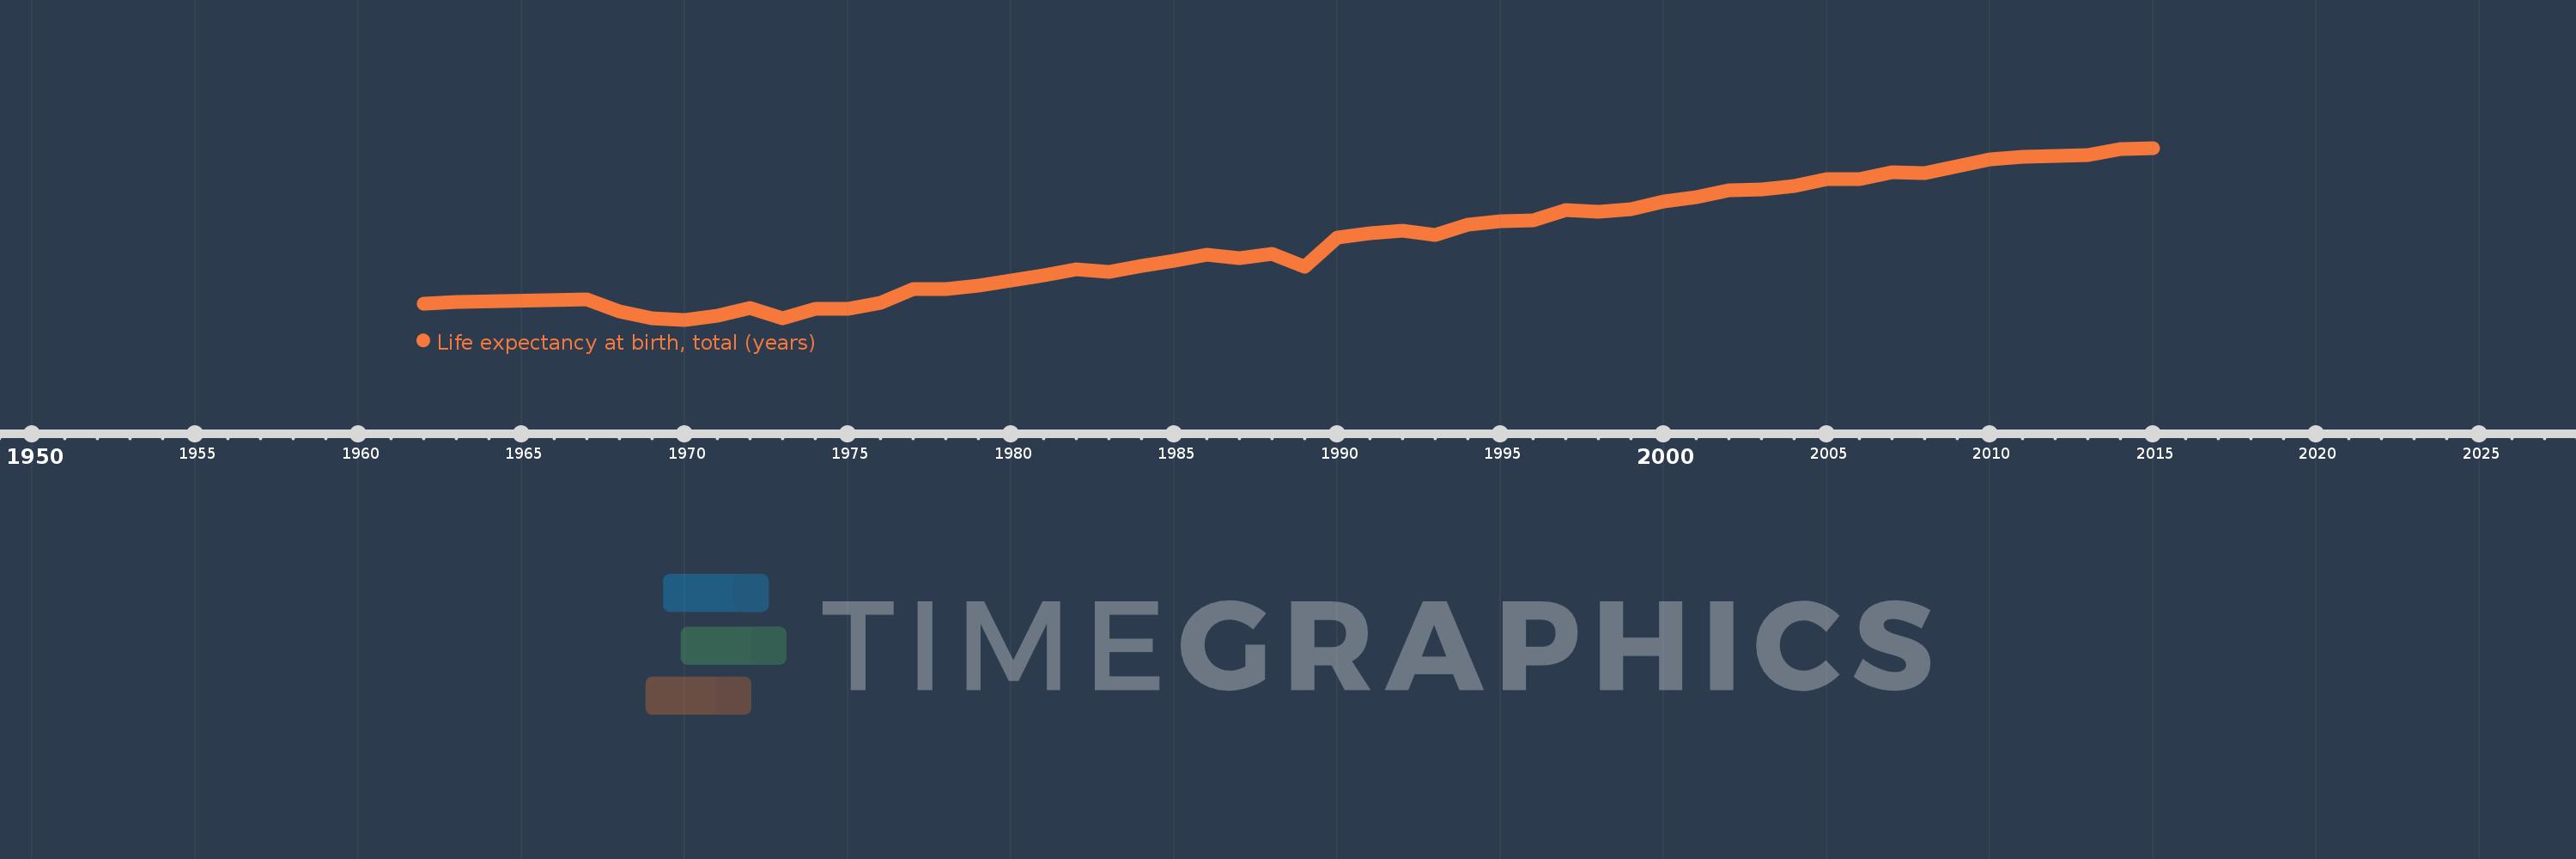
Life expectancy at birth, total (years)
2015,2014,2013,2012,2011,2010,2009,2008,2007,2006,2005,2004,2003,2002,2001,2000,1999,1998,1997,1996,1995,1994,1993,1992,1991,1990,1989,1988,1987,1986,1985,1984,1983,1982,1981,1980,1979,1978,1977,1976,1975,1974,1973,1972,1971,1970,1969,1968,1967,1963,1962
This statistics in other country:
AfghanistanAlbaniaAlgeriaAngolaAntigua and BarbudaArab WorldArgentinaArmeniaArubaAustraliaAustriaAzerbaijanBahamas, TheBahrainBangladeshBarbadosBelarusBelgiumBelizeBeninBermudaBhutanBoliviaBosnia and HerzegovinaBotswanaBrazilBrunei DarussalamBulgariaBurkina FasoBurundiCabo VerdeCambodiaCameroonCanadaCaribbean small statesCentral African RepublicCentral Europe and the BalticsChadChannel IslandsChileChinaColombiaComorosCongo, Dem. Rep.Congo, Rep.Costa RicaCote d'IvoireCroatiaCubaCuracaoCyprusCzech RepublicDenmarkDjiboutiDominicaDominican RepublicEarly-demographic dividendEast Asia & PacificEast Asia & Pacific (excluding high income)East Asia & Pacific (IDA & IBRD countries)EcuadorEgypt, Arab Rep.El SalvadorEquatorial GuineaEritreaEstoniaEthiopiaEuro areaEurope & Central AsiaEurope & Central Asia (excluding high income)Europe & Central Asia (IDA & IBRD countries)European UnionFaroe IslandsFijiFinlandFragile and conflict affected situationsFranceFrench PolynesiaGabonGambia, TheGeorgiaGermanyGhanaGreeceGreenlandGrenadaGuamGuatemalaGuineaGuinea-BissauGuyanaHaitiHeavily indebted poor countries (HIPC)High incomeHondurasHong Kong SAR, ChinaHungaryIBRD onlyIcelandIDA & IBRD totalIDA blendIDA onlyIDA totalIndiaIndonesiaIran, Islamic Rep.IraqIrelandIsle of ManIsraelItalyJamaicaJapanJordanKazakhstanKenyaKiribatiKorea, Dem. People’s Rep.Korea, Rep.KosovoKuwaitKyrgyz RepublicLao PDRLate-demographic dividendLatin America & Caribbean Latin America & Caribbean (excluding high income)Latin America & the Caribbean (IDA & IBRD countries)LatviaLeast developed countries: UN classificationLebanonLesothoLiberiaLibyaLiechtensteinLithuaniaLow & middle incomeLow incomeLower middle incomeLuxembourgMacao SAR, ChinaMacedonia, FYRMadagascarMalawiMalaysiaMaldivesMaliMaltaMarshall IslandsMauritaniaMauritiusMexicoMicronesia, Fed. Sts.Middle East & North AfricaMiddle East & North Africa (excluding high income)Middle East & North Africa (IDA & IBRD countries)Middle incomeMoldovaMongoliaMontenegroMoroccoMozambiqueMyanmarNamibiaNepalNetherlandsNew CaledoniaNew ZealandNicaraguaNigerNigeriaNorth AmericaNorwayOECD membersOmanOther small statesPacific island small statesPakistanPalauPanamaPapua New GuineaParaguayPeruPhilippinesPolandPortugalPost-demographic dividendPre-demographic dividendPuerto RicoQatarRomaniaRussian FederationRwandaSamoaSan MarinoSao Tome and PrincipeSaudi ArabiaSenegalSerbiaSeychellesSierra LeoneSingaporeSint Maarten (Dutch part)Slovak RepublicSloveniaSmall statesSolomon IslandsSomaliaSouth AfricaSouth AsiaSouth Asia (IDA & IBRD)South SudanSpainSri LankaSt. Kitts and NevisSt. LuciaSt. Martin (French part)St. Vincent and the GrenadinesSub-Saharan Africa Sub-Saharan Africa (excluding high income)Sub-Saharan Africa (IDA & IBRD countries)SudanSurinameSwazilandSwedenSwitzerlandSyrian Arab RepublicTajikistanTanzaniaThailandTimor-LesteTogoTongaTrinidad and TobagoTunisiaTurkeyTurkmenistanUgandaUkraineUnited Arab EmiratesUnited KingdomUnited StatesUpper middle incomeUruguayUzbekistanVanuatuVenezuela, RBVietnamVirgin Islands (U.S.)West Bank and GazaWorldYemen, Rep.ZambiaZimbabwe Timeline:
This timeline shows a graph from 1962 to 2015 of Israel. No data until 1961. Number of actual observations by date: 51.
Source name:
World Development Indicators
Source organization:
Derived from male and female life expectancy at birth from sources such as: (1) United Nations Population Division. World Population Prospects, (2) Census reports and other statistical publications from national statistical offices, (3) Eurostat: Demographic Statistics, (4) United Nations Statistical Division. Population and Vital Statistics Reprot (various years), (5) U.S. Census Bureau: International Database, and (6) Secretariat of the Pacific Community: Statistics and Demography Programme.
Categories, topics:
Health
Last updated:
apr 23, 2017
Indicators value changes by year
Maximum:
82.154
jan 1, 2015
At the date of observation
Value
Absolute change
Change from previous value
jan 1, 1962
72.007
+72.007
0.0%
jan 1, 1963
72.112
+0.106
0.15%
jan 1, 1967
72.286
+0.173
0.24%
jan 1, 1968
71.51
-0.776
-1.07%
jan 1, 1969
71.057
-0.453
-0.63%
jan 1, 1970
70.97
-0.086
-0.12%
jan 1, 1971
71.213
+0.243
0.34%
jan 1, 1972
71.719
+0.506
0.71%
jan 1, 1973
71.078
-0.641
-0.89%
jan 1, 1974
71.693
+0.615
0.87%
jan 1, 1975
71.662
-0.032
-0.04%
jan 1, 1976
72.045
+0.383
0.54%
jan 1, 1977
72.956
+0.911
1.26%
jan 1, 1978
72.959
+0.002
0.0%
jan 1, 1979
73.207
+0.249
0.34%
jan 1, 1980
73.507
+0.3
0.41%
jan 1, 1981
73.876
+0.368
0.5%
jan 1, 1982
74.261
+0.385
0.52%
jan 1, 1983
74.11
-0.151
-0.2%
jan 1, 1984
74.459
+0.349
0.47%
jan 1, 1985
74.807
+0.349
0.47%
jan 1, 1986
75.207
+0.4
0.53%
jan 1, 1987
74.956
-0.251
-0.33%
jan 1, 1988
75.259
+0.302
0.4%
jan 1, 1989
74.437
-0.822
-1.09%
jan 1, 1990
76.307
+1.871
2.51%
jan 1, 1991
76.607
+0.3
0.39%
jan 1, 1992
76.759
+0.151
0.2%
jan 1, 1993
76.505
-0.254
-0.33%
jan 1, 1994
77.154
+0.649
0.85%
jan 1, 1995
77.402
+0.249
0.32%
jan 1, 1996
77.451
+0.049
0.06%
jan 1, 1997
78.105
+0.654
0.84%
jan 1, 1998
78.0
-0.105
-0.13%
jan 1, 1999
78.149
+0.149
0.19%
jan 1, 2000
78.659
+0.51
0.65%
jan 1, 2001
78.954
+0.295
0.38%
jan 1, 2002
79.407
+0.454
0.57%
jan 1, 2003
79.451
+0.044
0.06%
jan 1, 2004
79.649
+0.198
0.25%
jan 1, 2005
80.146
+0.498
0.62%
jan 1, 2006
80.151
+0.005
0.01%
jan 1, 2007
80.554
+0.402
0.5%
jan 1, 2008
80.505
-0.049
-0.06%
jan 1, 2009
80.951
+0.446
0.55%
jan 1, 2010
81.405
+0.454
0.56%
jan 1, 2011
81.602
+0.198
0.24%
jan 1, 2012
81.656
+0.054
0.07%
jan 1, 2013
81.705
+0.049
0.06%
jan 1, 2014
82.056
+0.351
0.43%
jan 1, 2015
82.154
+0.098
0.12%
Ranking of countries by current statistics by years


Comments: