29
/
en
AIzaSyAYiBZKx7MnpbEhh9jyipgxe19OcubqV5w
April 1, 2024
36722
IBRD only
IBD
false
2
1
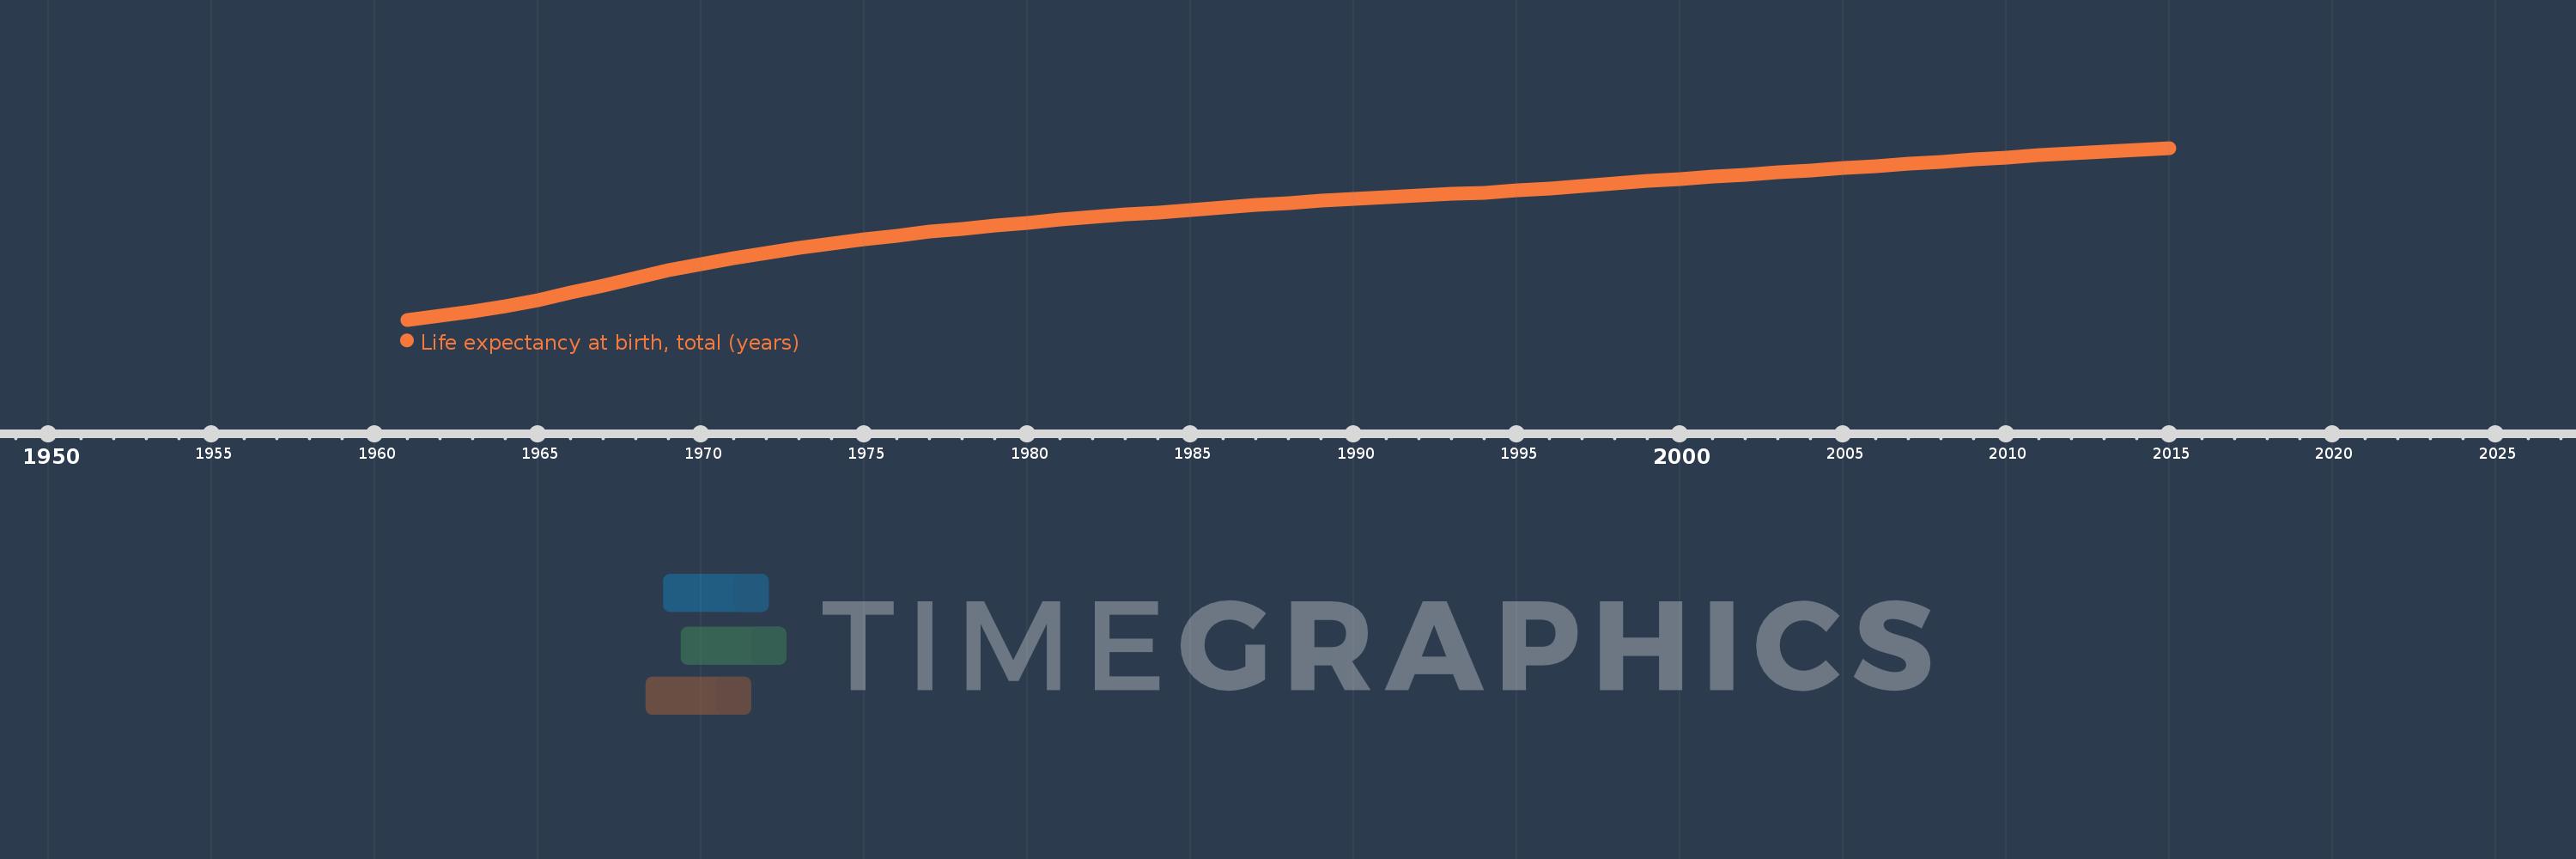
Life expectancy at birth, total (years)
2015,2014,2013,2012,2011,2010,2009,2008,2007,2006,2005,2004,2003,2002,2001,2000,1999,1998,1997,1996,1995,1994,1993,1992,1991,1990,1989,1988,1987,1986,1985,1984,1983,1982,1981,1980,1979,1978,1977,1976,1975,1974,1973,1972,1971,1970,1969,1968,1967,1966,1965,1964,1963,1962,1961
This statistics in other country:
AfghanistanAlbaniaAlgeriaAngolaAntigua and BarbudaArab WorldArgentinaArmeniaArubaAustraliaAustriaAzerbaijanBahamas, TheBahrainBangladeshBarbadosBelarusBelgiumBelizeBeninBermudaBhutanBoliviaBosnia and HerzegovinaBotswanaBrazilBrunei DarussalamBulgariaBurkina FasoBurundiCabo VerdeCambodiaCameroonCanadaCaribbean small statesCentral African RepublicCentral Europe and the BalticsChadChannel IslandsChileChinaColombiaComorosCongo, Dem. Rep.Congo, Rep.Costa RicaCote d'IvoireCroatiaCubaCuracaoCyprusCzech RepublicDenmarkDjiboutiDominicaDominican RepublicEarly-demographic dividendEast Asia & PacificEast Asia & Pacific (excluding high income)East Asia & Pacific (IDA & IBRD countries)EcuadorEgypt, Arab Rep.El SalvadorEquatorial GuineaEritreaEstoniaEthiopiaEuro areaEurope & Central AsiaEurope & Central Asia (excluding high income)Europe & Central Asia (IDA & IBRD countries)European UnionFaroe IslandsFijiFinlandFragile and conflict affected situationsFranceFrench PolynesiaGabonGambia, TheGeorgiaGermanyGhanaGreeceGreenlandGrenadaGuamGuatemalaGuineaGuinea-BissauGuyanaHaitiHeavily indebted poor countries (HIPC)High incomeHondurasHong Kong SAR, ChinaHungaryIBRD onlyIcelandIDA & IBRD totalIDA blendIDA onlyIDA totalIndiaIndonesiaIran, Islamic Rep.IraqIrelandIsle of ManIsraelItalyJamaicaJapanJordanKazakhstanKenyaKiribatiKorea, Dem. People’s Rep.Korea, Rep.KosovoKuwaitKyrgyz RepublicLao PDRLate-demographic dividendLatin America & Caribbean Latin America & Caribbean (excluding high income)Latin America & the Caribbean (IDA & IBRD countries)LatviaLeast developed countries: UN classificationLebanonLesothoLiberiaLibyaLiechtensteinLithuaniaLow & middle incomeLow incomeLower middle incomeLuxembourgMacao SAR, ChinaMacedonia, FYRMadagascarMalawiMalaysiaMaldivesMaliMaltaMarshall IslandsMauritaniaMauritiusMexicoMicronesia, Fed. Sts.Middle East & North AfricaMiddle East & North Africa (excluding high income)Middle East & North Africa (IDA & IBRD countries)Middle incomeMoldovaMongoliaMontenegroMoroccoMozambiqueMyanmarNamibiaNepalNetherlandsNew CaledoniaNew ZealandNicaraguaNigerNigeriaNorth AmericaNorwayOECD membersOmanOther small statesPacific island small statesPakistanPalauPanamaPapua New GuineaParaguayPeruPhilippinesPolandPortugalPost-demographic dividendPre-demographic dividendPuerto RicoQatarRomaniaRussian FederationRwandaSamoaSan MarinoSao Tome and PrincipeSaudi ArabiaSenegalSerbiaSeychellesSierra LeoneSingaporeSint Maarten (Dutch part)Slovak RepublicSloveniaSmall statesSolomon IslandsSomaliaSouth AfricaSouth AsiaSouth Asia (IDA & IBRD)South SudanSpainSri LankaSt. Kitts and NevisSt. LuciaSt. Martin (French part)St. Vincent and the GrenadinesSub-Saharan Africa Sub-Saharan Africa (excluding high income)Sub-Saharan Africa (IDA & IBRD countries)SudanSurinameSwazilandSwedenSwitzerlandSyrian Arab RepublicTajikistanTanzaniaThailandTimor-LesteTogoTongaTrinidad and TobagoTunisiaTurkeyTurkmenistanUgandaUkraineUnited Arab EmiratesUnited KingdomUnited StatesUpper middle incomeUruguayUzbekistanVanuatuVenezuela, RBVietnamVirgin Islands (U.S.)West Bank and GazaWorldYemen, Rep.ZambiaZimbabwe Timeline:
This timeline shows a graph from 1961 to 2015 of IBRD only. No data until 1960. Number of actual observations by date: 55.
Source name:
World Development Indicators
Source organization:
Derived from male and female life expectancy at birth from sources such as: (1) United Nations Population Division. World Population Prospects, (2) Census reports and other statistical publications from national statistical offices, (3) Eurostat: Demographic Statistics, (4) United Nations Statistical Division. Population and Vital Statistics Reprot (various years), (5) U.S. Census Bureau: International Database, and (6) Secretariat of the Pacific Community: Statistics and Demography Programme.
Categories, topics:
Health
Last updated:
apr 23, 2017
Indicators value changes by year
Minimum:
48.283
jan 1, 1961
Maximum:
72.051
jan 1, 2015
At the date of observation
Value
Absolute change
Change from previous value
jan 1, 1961
48.283
+48.283
0.0%
jan 1, 1962
48.803
+0.52
1.08%
jan 1, 1963
49.404
+0.602
1.23%
jan 1, 1964
50.149
+0.745
1.51%
jan 1, 1965
51.025
+0.876
1.75%
jan 1, 1966
52.015
+0.99
1.94%
jan 1, 1967
53.053
+1.038
2.0%
jan 1, 1968
54.081
+1.028
1.94%
jan 1, 1969
55.082
+1.001
1.85%
jan 1, 1970
55.978
+0.896
1.63%
jan 1, 1971
56.811
+0.833
1.49%
jan 1, 1972
57.544
+0.733
1.29%
jan 1, 1973
58.212
+0.668
1.16%
jan 1, 1974
58.834
+0.622
1.07%
jan 1, 1975
59.425
+0.592
1.01%
jan 1, 1976
59.934
+0.508
0.86%
jan 1, 1977
60.435
+0.502
0.84%
jan 1, 1978
60.897
+0.462
0.76%
jan 1, 1979
61.332
+0.435
0.71%
jan 1, 1980
61.724
+0.392
0.64%
jan 1, 1981
62.094
+0.37
0.6%
jan 1, 1982
62.47
+0.376
0.61%
jan 1, 1983
62.83
+0.36
0.58%
jan 1, 1984
63.145
+0.315
0.5%
jan 1, 1985
63.432
+0.287
0.45%
jan 1, 1986
63.763
+0.331
0.52%
jan 1, 1987
64.139
+0.376
0.59%
jan 1, 1988
64.441
+0.301
0.47%
jan 1, 1989
64.731
+0.291
0.45%
jan 1, 1990
64.997
+0.265
0.41%
jan 1, 1991
65.259
+0.263
0.4%
jan 1, 1992
65.505
+0.246
0.38%
jan 1, 1993
65.706
+0.201
0.31%
jan 1, 1994
65.892
+0.186
0.28%
jan 1, 1995
66.145
+0.253
0.38%
jan 1, 1996
66.457
+0.312
0.47%
jan 1, 1997
66.791
+0.334
0.5%
jan 1, 1998
67.148
+0.357
0.53%
jan 1, 1999
67.462
+0.314
0.47%
jan 1, 2000
67.759
+0.297
0.44%
jan 1, 2001
68.061
+0.302
0.45%
jan 1, 2002
68.389
+0.328
0.48%
jan 1, 2003
68.679
+0.291
0.42%
jan 1, 2004
68.975
+0.295
0.43%
jan 1, 2005
69.282
+0.307
0.45%
jan 1, 2006
69.559
+0.277
0.4%
jan 1, 2007
69.876
+0.316
0.45%
jan 1, 2008
70.173
+0.297
0.43%
jan 1, 2009
70.447
+0.274
0.39%
jan 1, 2010
70.745
+0.298
0.42%
jan 1, 2011
71.019
+0.274
0.39%
jan 1, 2012
71.306
+0.287
0.4%
jan 1, 2013
71.574
+0.267
0.37%
jan 1, 2014
71.817
+0.244
0.34%
jan 1, 2015
72.051
+0.234
0.33%
Ranking of countries by current statistics by years


Comments: